In the previous post I started to explore the metadata edit events dataset generated from 94,222 edit events from 2014 for the UNT Libraries’ Digital Collections. I focused on some of the information about when these edits were performed.
This post focuses on the “who” of the dataset.
All together we had 193 unique users edit metadata for one of the systems that comprise the UNT Libraries’ Digital Collections. This includes The Portal to Texas History, UNT Digital Library, and the Gateway to Oklahoma History.
The top ten most frequent editors of metadata in the system are responsible for 57% of the overall edits.
| Username | Edit Events |
| htarver | 15,451 |
| aseitsinger | 10,105 |
| twarner | 4,655 |
| mjohnston | 4,143 |
| atraxinger | 3,905 |
| cwilliams | 3,490 |
| sfisher | 3,466 |
| thuang | 3,327 |
| mphillips | 2,669 |
| sdillard | 2,518 |
The overall distribution of edits per user looks like this.
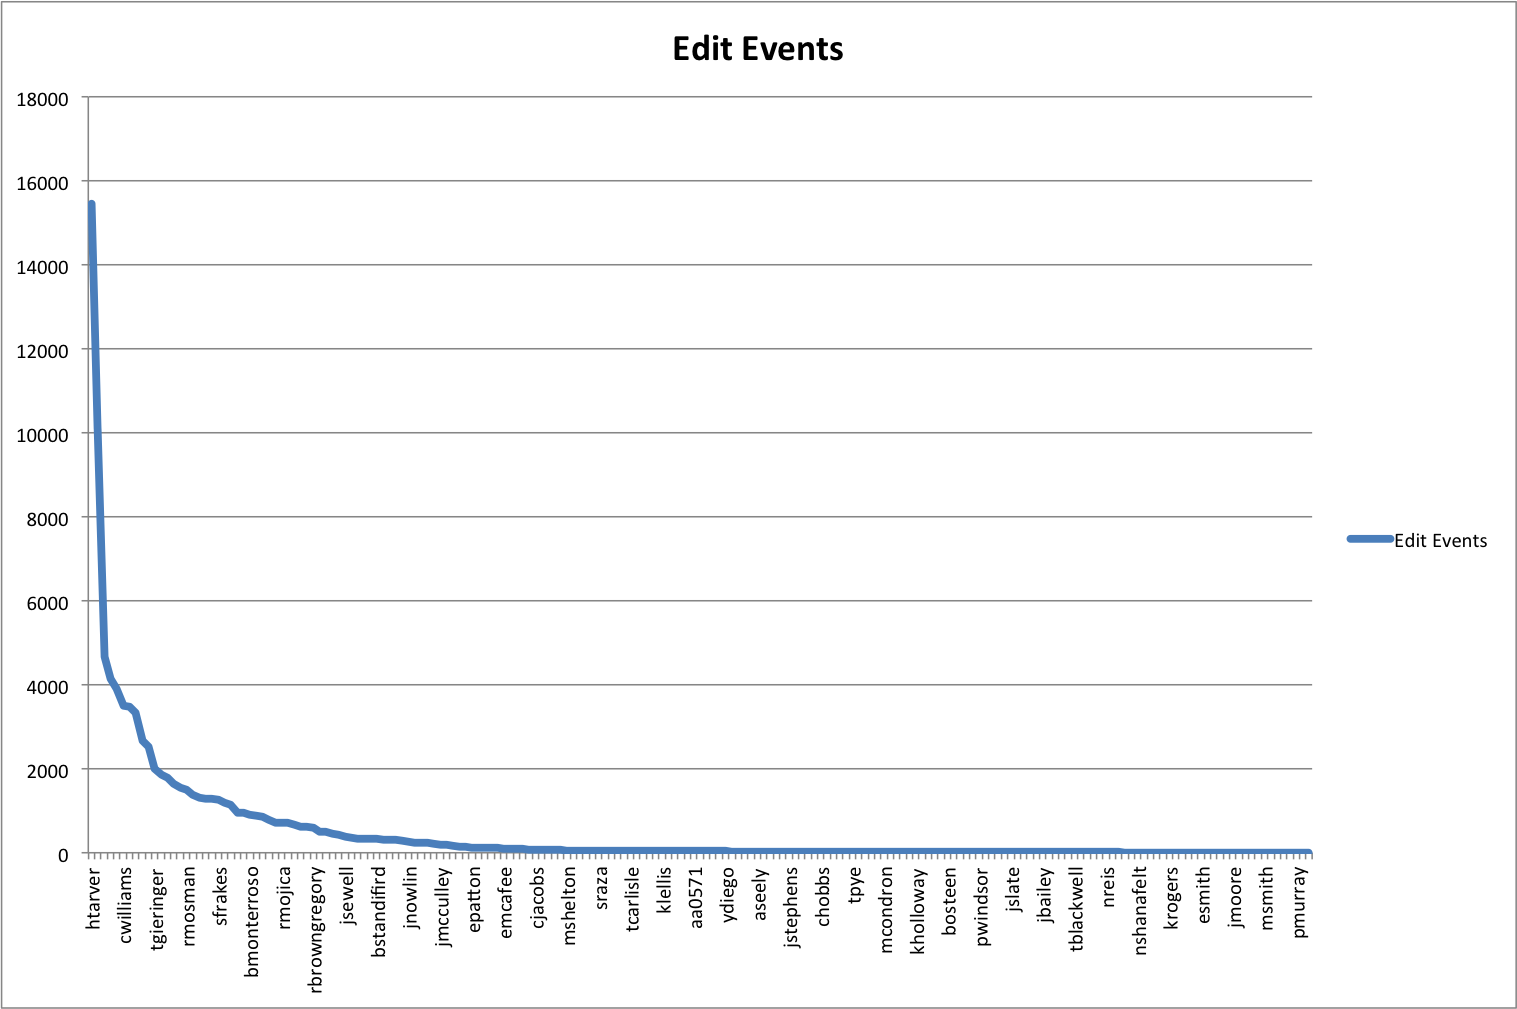
Distribution of edits per user for the Edit Event Dataset
As you can see it shows the primary users of the system and then very quickly tapers down to the “long tail” of users who have a lower number of edit events.
A quick look at the total number of users active for given days of the week across the entire dataset.
| Sun | Mon | Tue | Wed | Thu | Fri | Sat |
| 40 | 95 | 122 | 122 | 123 | 97 | 39 |
There is a swell for Tue, Wed, and Thu in the table above. It seems to be pretty consistent, either you have 39,40 users, 95-97 users, or 122-123 unique users on a given day of the week.
In looking at how unique users were spread across the year, grouped into months, we got the following table and then graph.
| Month | Unique Users |
| January | 54 |
| February | 73 |
| March | 64 |
| April | 61 |
| May | 44 |
| June | 40 |
| July | 48 |
| August | 50 |
| September | 50 |
| October | 84 |
| November | 49 |
| December | 36 |

Unique Editors Per Month
There were some spikes throughout the year, most likely related to a metadata class in the UNT College of Information that uses the Edit system as part of their teaching. This is the October and February spikes in number of unique users. Other than that we are a consistently over 40 unique users per month with a small dip for the December holiday season when school is not is session.
In the previous post we had a heatmap with the number of edit events distributed over the hours of the day and the days of the week. I’ve included that graph below.
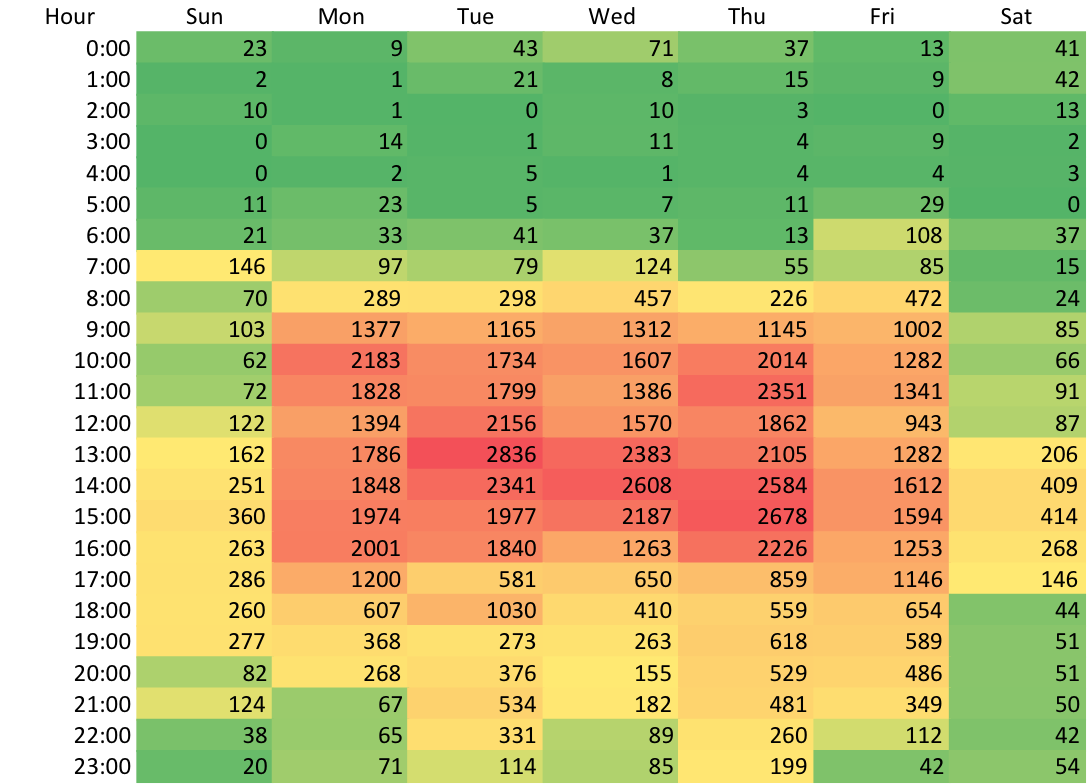
94,222 edit events plotted to the time and day they were performed
I was curious to see how the unique number of editors mapped to this same type of graph, so that is included below.
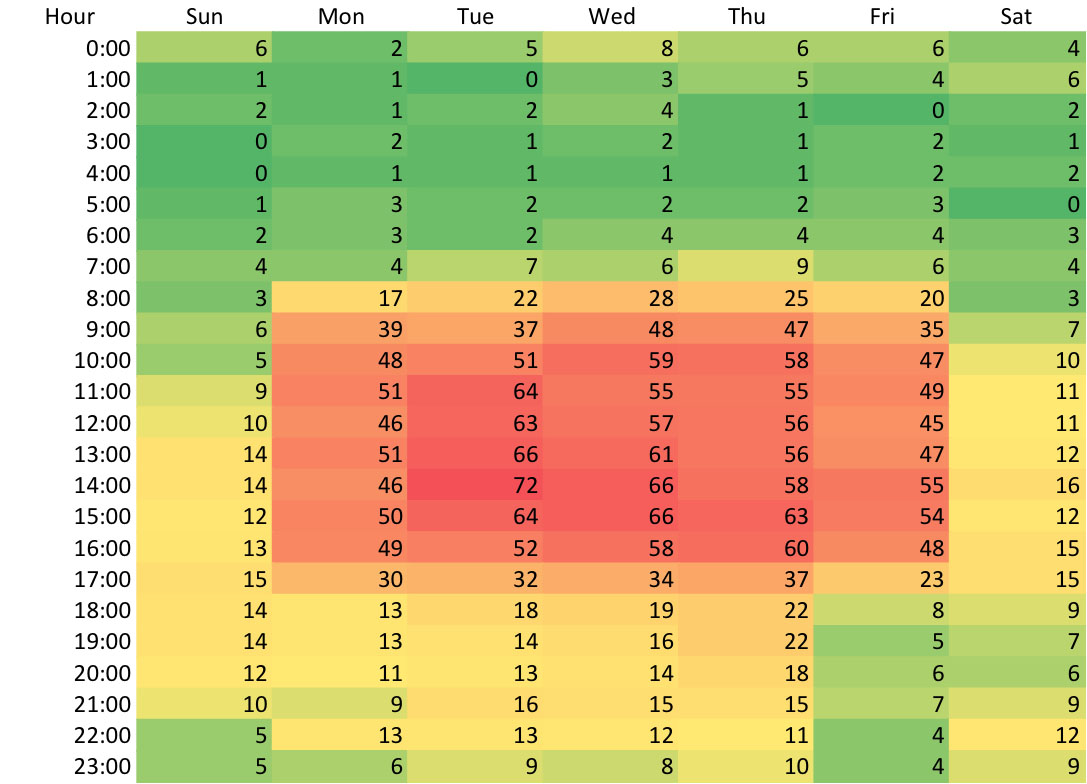
Unique editors distribution across day of the week and hour of the day.
User Status
Of the 193 unique metadata editors in the dataset, 135 (70%) of the users were classified as Non-UNT-Employee and 58 (30%) were classified as UNT-Employee. For the edit events themselves, 75,968 (81%) were completed by users classified with a status of UNT-Employee and 18,254 (19%) by users classified with the status of Non-UNT-Employee.
User Rank
| Rank | Edit Events | Percentage of Total Edits (n=94,222) | Unique Users | Percentage of Total Users (n=193) |
| Librarian | 22,466 | 24% | 16 | 8% |
| Staff | 12,837 | 14% | 13 | 7% |
| Student | 41,800 | 44% | 92 | 48% |
| Unknown | 17,119 | 18% | 72 | 37% |
You can see that 44% of all of the edits in the dataset were completed by users who were students. Librarians and Staff members accounted for 38% of the edits.
This is the second in a series of posts related to metadata edit events in the UNT Libraries’ Digital Collections. check back for the next installment.
As always feel free to contact me via Twitter if you have questions or comments.