This is the third post in a series related to metadata event data that we collected from January 1, 2014 to December 31, 2014 for the UNT Libraries Digital Collections. We collected 94,222 metadata editing events during this time.
The first post was about the when of the events, when did they occur, what day of the week and what day of the week the occurred.
The second post touched on the who of the events, who were the main metadata editors, how were edits distributed among the different users, and how the number of years per month, day, hour were distributed.
This post will look at the what of the events data. What were the records that were touched, what collections or partners did they belong to and so on.
Of the total 94,222 edit events there were 68,758 unique metadata records edited.
By using the helpful st program we can quickly get the statistics for these 68,758 unique metadata records. By choosing the “complete” stats we get the following data.
| N | min | q1 | median | q3 | max | sum | mean | stddev | stderr |
| 68,758 | 1 | 1 | 1 | 1 | 45 | 94,222 | 1.37034 | 0.913541 | 0.0034839 |
With this we can see that there is a mean of 1.37 edits per record over the entire dataset with the maximum number of edits for a record being 45.
The total distribution of number of edits-per-record a presented in the table below.
| Number of Edits | Instances |
| 1 | 53,213 |
| 2 | 9,937 |
| 3 | 3,519 |
| 4 | 1,089 |
| 5 | 489 |
| 6 | 257 |
| 7 | 111 |
| 8 | 60 |
| 9 | 30 |
| 10 | 13 |
| 11 | 14 |
| 12 | 7 |
| 13 | 5 |
| 14 | 5 |
| 15 | 1 |
| 16 | 2 |
| 17 | 1 |
| 19 | 1 |
| 21 | 1 |
| 26 | 1 |
| 30 | 1 |
| 45 | 1 |
From the 68,758 records edited, 53,213 (77%) of the records were only edited once, with two and three edits per record edit 9,937 (14%), and 3,519 (5%) respectively. From there things level out very quickly to under 1% of the records.
When indexing these edit events in Solr I also merged the events with additional metadata from the records. By doing so we have a few more facets to take a look at, specifically how the edit events are distributed over partner, collection, resource type and format.
Partner/Institution
There are 167 partner institutions represented in the edit event dataset.
The top ten partners by the number of edit events is presented in the table below.
| Partner Code | Partner Name | Edit Count | Unique Records Edited | Unique Collections |
| UNTGD | UNT Libraries Gov Docs Department | 21,932 | 14,096 | 27 |
| OKHS | Oklahoma Historical Society | 10,377 | 8,801 | 34 |
| UNTA | UNT Libraries Special Collections | 9,481 | 6,027 | 25 |
| UNT | UNT Libraries | 7,102 | 5,274 | 27 |
| PCJB | Private Collection of Jim Bell | 5,504 | 5,322 | 1 |
| HMRC | Houston Metropolitan Research Center at Houston Public Library | 5,396 | 2,125 | 5 |
| HPUL | Howard Payne University Library | 4,531 | 4,518 | 4 |
| UNTCVA | UNT College of Visual Arts and Design | 4,296 | 3,464 | 5 |
| HSUL | Hardin-Simmons University Library | 2,765 | 2,593 | 6 |
| HIGPL | Higgins Public Library | 1,935 | 1,130 | 3 |
In addition to the number of edit events, I have added a column for the number of unique records for each of the institutions. The same data is presented in the graph below.

Graph showing the edit event count and unique record count for each of the institutions with the most edit events
The larger the difference between the Edit Count and the Unique Records Edited represents more repetitive edits of the same records by that partner.
The final column in the table above shows the number of different collections that were edited that belong to each specific partner. Taking UNTGD as an example, there are 27 different collection that held records that were edited during the year.
| Collection Code | Collection Name | Edit Events | Records Edited |
| TLRA | Texas Laws and Resolutions Archive | 8,629 | 5,187 |
| TXPT | Texas Patents | 7,394 | 4,636 |
| TXSAOR | Texas State Auditor’s Office: Reports | 2,724 | 1,223 |
| USCMC | United States Census Map Collection | 1,779 | 1,695 |
| USTOPO | USGS Topographic Map Collection | 490 | 458 |
| TRAIL | Technical Report Archive and Image Library | 287 | 279 |
| CRSR | Congressional Research Service Reports | 271 | 270 |
| FCCRD | Federal Communications Commission Record | 211 | 208 |
| NACA | National Advisory Committee for Aeronautics Collection | 62 | 62 |
| WWPC | World War Poster Collection | 49 | 49 |
| WWI | World War One Collection | 41 | 41 |
| USDAFB | USDA Farmers’ Bulletins | 21 | 19 |
| ATOZ | Government Documents A to Z Digitization Project | 19 | 18 |
| WWII | World War Two Collection | 19 | 19 |
| ACIR | Advisory Commission on Intergovernmental Relations | 14 | 13 |
| NMAP | World War Two Newsmaps | 12 | 12 |
| TR | Texas Register | 12 | 8 |
| TXPUB | Texas State Publications | 12 | 12 |
| GAORT | Government Accountability Office Reports | 10 | 10 |
| BRAC | Defense Base Closure and Realignment Commission | 4 | 4 |
| OTA | Office of Technology Assessment | 4 | 4 |
| GDCC | CyberCemetery | 2 | 2 |
| FEDER | Federal Communications Commission Record | 1 | 1 |
| GSLTX | General and Special Laws of Texas | 1 | 1 |
| TXHRJ | Texas House of Representatives Journals | 1 | 1 |
| TXSS | Texas Soil Surveys | 1 | 1 |
| UNTGOV | Government Documents General Collection | 1 | 1 |
This is set of data that is a bit easer to see with a simple graph. I’ve plotted the ratio of records and the number of edit events to a simple line graph.
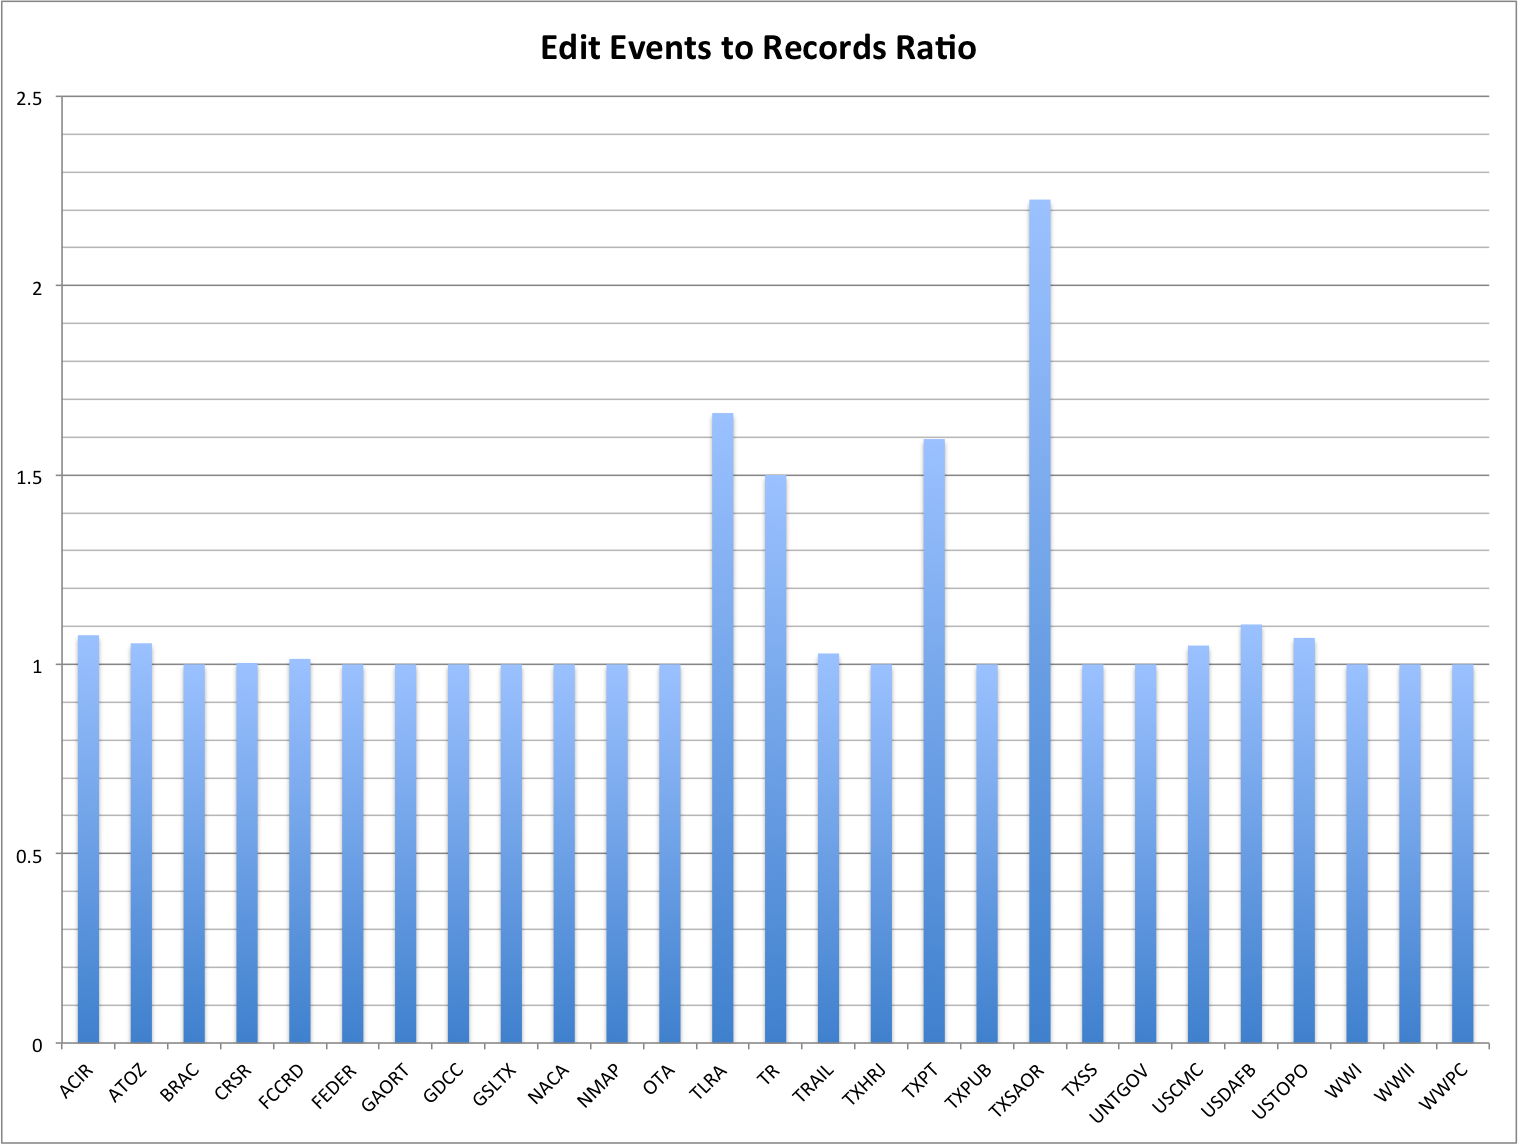
UNT Government Documents Edits to Record Ratios for each collection.
You can look at the graph above and quickly see which of the collections have had a higher edit-to-record ratio with the Texas State Auditor’s Office: Reports being the most number of edits per record with a ratio of over 2 edits per record for that collection. Many of the other collections are much closer to 1 where there would be one edit per record.
Collections
The edit events occur in 266 different collections in the UNT Libraries’ Digital Collections. As with the 167 partners above, that is too many to stick into a table so I’m going to just list the top ten of them for us in the table below.
| Collection Code | Collection Name | Edit Events | Unique Records |
| TLRA | Texas Laws and Resolutions Archive | 8,629 | 5,187 |
| ABCM | Abilene Library Consortium | 8,481 | 8,060 |
| TDNP | Texas Digital Newspaper Program | 7,618 | 6,305 |
| TXPT | Texas Patents | 7,394 | 4,636 |
| OKPCP | Oklahoma Publishing Company Photography Collection | 5,799 | 4,729 |
| JBPC | Jim Bell Texas Architecture Photograph Collection | 5,504 | 5,322 |
| TCO | Texas Cultures Online | 5,490 | 2,208 |
| JJHP | John J. Herrera Papers | 5,194 | 1,996 |
| UNTETD | UNT Theses and Dissertations | 4,981 | 3,704 |
| UNTPC | University Photography Collection | 4,509 | 3,232 |
Again plotting the ratio of edit events to the number of unique records gives us the graph below.
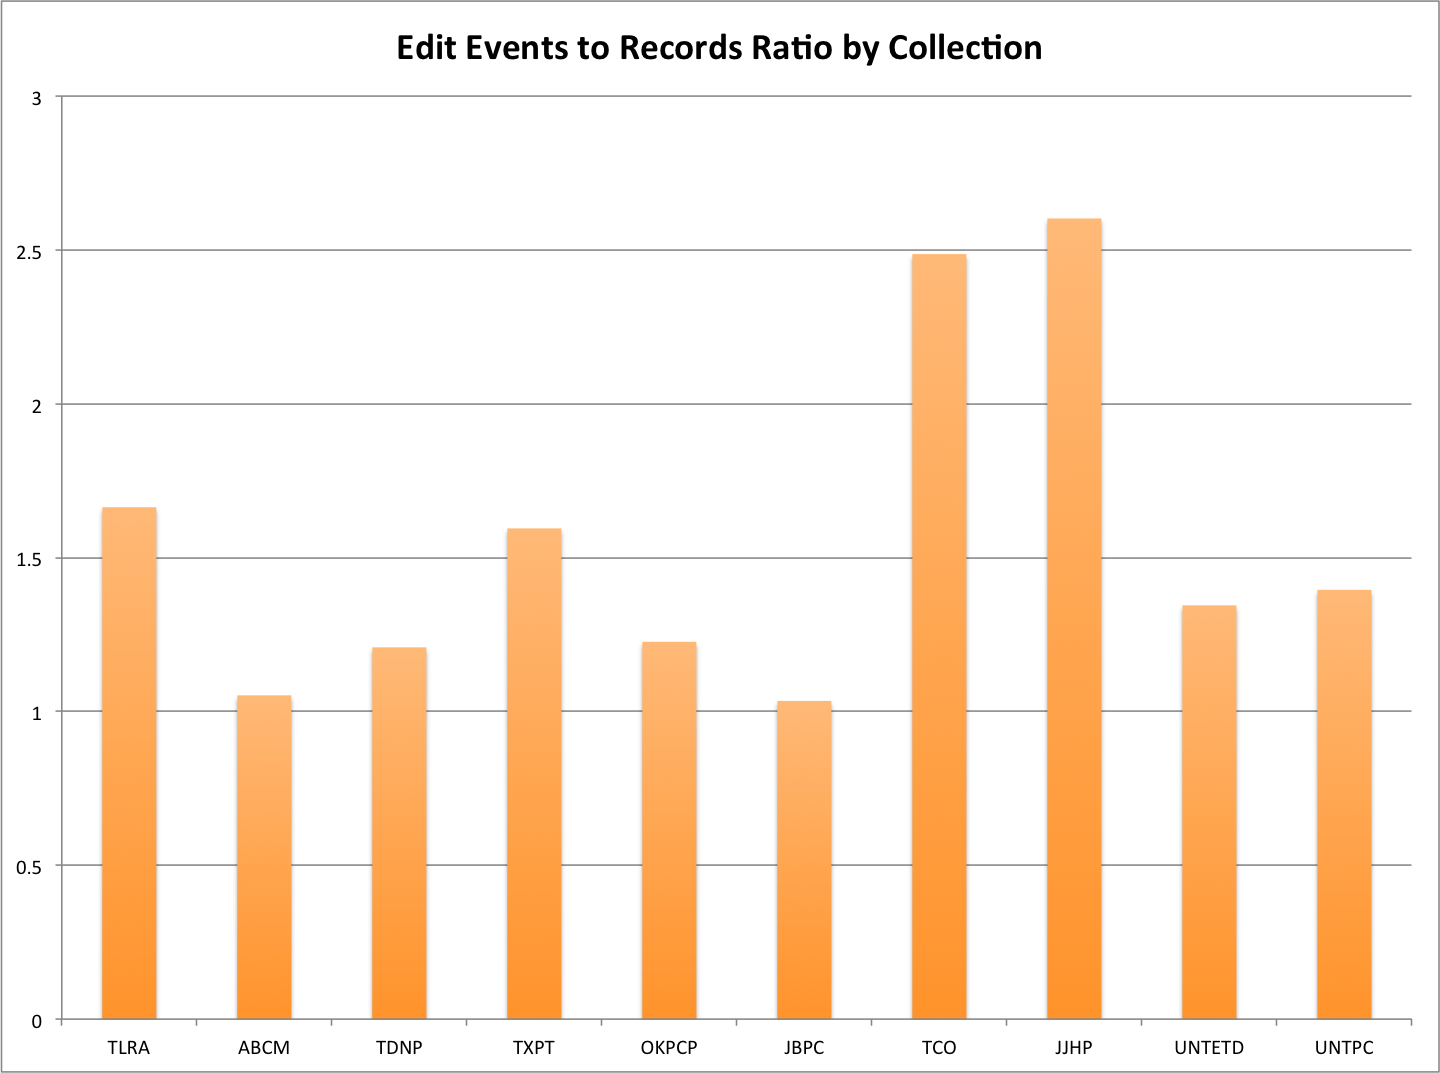
Edit Events to Record Ratio grouped by Collection
You can quickly see the two collections that averaged over two edit events for each of the records that were edited during the last year, meaning if a record was edited, most likely it was edited at least two times. Other collections like the Jim Bell Photography Collection or the Abilene Library Consortium Collection appear to have only been edited one time per record on average, so when the edit was complete, it wasn’t revisited for additional editing.
Resource Type
The UNT Libraries makes use of a locally controlled vocabulary for its resource types. You can view all of the available resource types here .
If you group the edit events and associated edit events by the resource type you will get the following table.
| Resource Type | Edit Events | Unique Records |
| image_photo | 31,702 | 24,384 |
| text_newspaper | 11,598 | 10,176 |
| text_leg | 8,633 | 5,191 |
| text_patent | 7,480 | 4,667 |
| physical-object | 5,591 | 4,921 |
| text_etd | 4,986 | 3,709 |
| text | 4,311 | 2,511 |
| text_letter | 4,276 | 2,136 |
| image_map | 3,542 | 3,160 |
| text_report | 3,375 | 1,822 |
| image_artwork | 1,217 | 1,042 |
| text_article | 1,060 | 758 |
| video | 931 | 461 |
| sound | 719 | 694 |
| text_legal | 687 | 341 |
| text_journal | 549 | 288 |
| text_book | 476 | 422 |
| image_presentation | 430 | 313 |
| image_postcard | 429 | 180 |
| image_poster | 427 | 321 |
| text_paper | 423 | 312 |
| text_pamphlet | 303 | 199 |
| text_clipping | 275 | 149 |
| text_yearbook | 91 | 66 |
| dataset | 54 | 19 |
| image_score | 49 | 37 |
| collection | 41 | 34 |
| image | 34 | 20 |
| website | 22 | 20 |
| text_chapter | 17 | 14 |
| text_review | 13 | 11 |
| text_poem | 3 | 1 |
| specimen | 1 | 1 |
By calculating the edit-event-to-record ratio and plotting that you get the following graph.
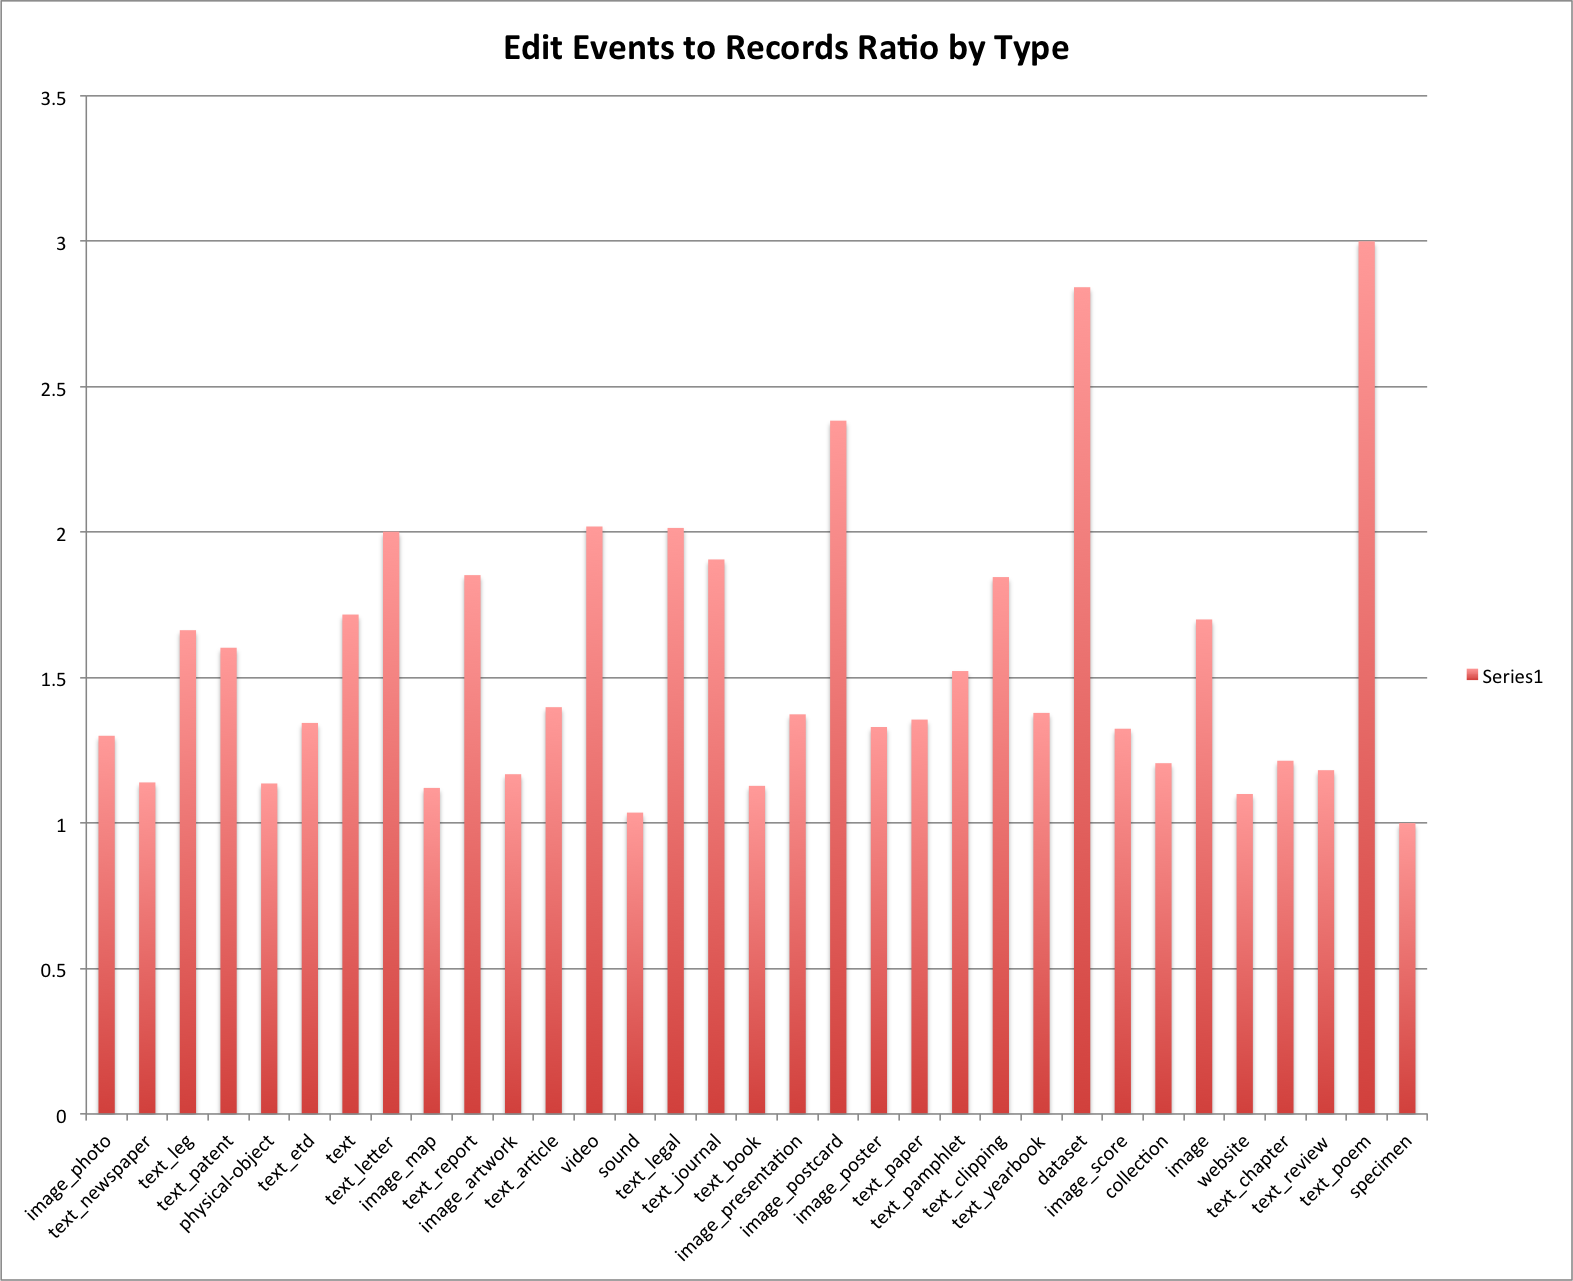
Edit Events to Record Ratio grouped by Resource Type.
In the graph above I presented the data in the same order as it appears in the table just above the chart. You can see that the highest ratio is for our text_poem record that was edited three different times. Other notably high ratios are for postcards and datasets though there are several others that are at or close to 2 to 1 ratio of edits to records.
Format
The final way we are going to look at the “what” data is by Format. Again the UNT Libraries uses a controlled vocabulary for the format which you can look at here. I’ve once again facetted on the format field and presented the total number of edit events and then unique records for each of the five format types that we have in the system.
| Format | Edit Events | Unique Records |
| text | 48,580 | 32,770 |
| image | 43,477 | 34,436 |
| video | 931 | 461 |
| audio | 720 | 695 |
| website | 22 | 20 |
Converting the ratio of events-to-records into a bar graph results in the graph below.
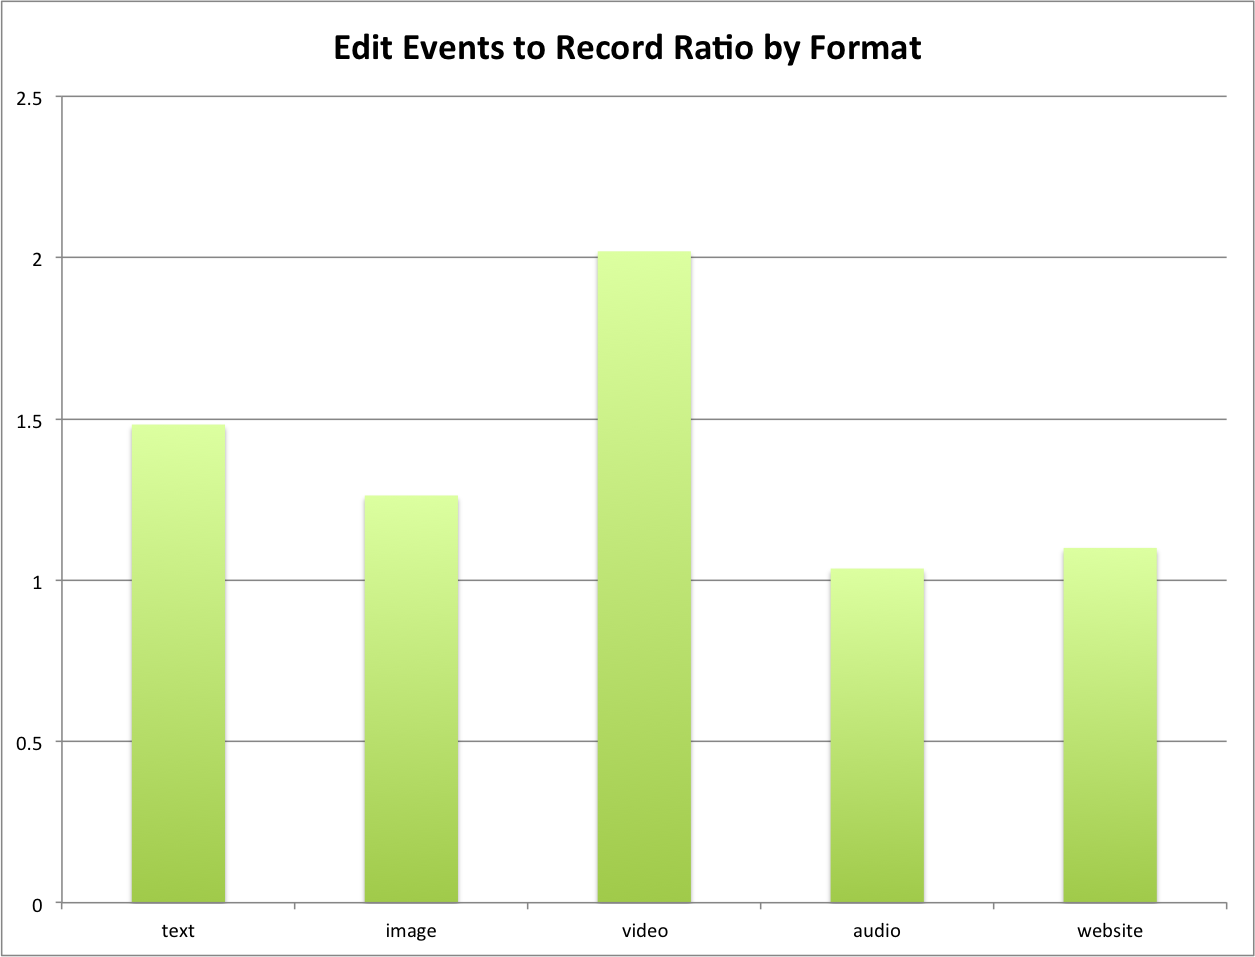
Edit Events to Record Ratio grouped by Format
It looks like we edit video files more times per record than any of the other types with text and then image coming in behind.
Closing
There are almost endless combinations of collections, partners, resource types, and formats that can be put together and it deserves some further analysis to see if there are patters that we should pay attention to present in the data. But that’s more for another day.
This is the third in a series of posts related to metadata edit events in the UNT Libraries’ Digital Collections. check back for the next installment.
As always feel free to contact me via Twitter if you have questions or comments.