This is the fourth in a series of posts related to metadata edit events collected by the UNT Libraries from its digital library system from January 1, 2014 until December 31, 2014. The previous posts covered when, who, and what.
This post will start the discussion on the “how long” or duration of the dataset.
Libraries, archives, and museums have long discussed the cost of metadata creation and improvement projects, depending on the size, complexity and experience of the metadata creators, the costs associated with metadata generation, manipulation and improvement can vary drastically.
The amount of time that a person takes to create or edit a specific metadata record is often used in the calculations of what projects will cost to complete. At the UNT Libraries we have used $3.00 per descriptive record as our metadata costs for projects, and based on the level of metadata created, workflows use, and the system we’ve developed for metadata creation, this number seems to do a good job of covering our metadata creation costs. It will be interesting to get a sense of how much time was spent editing metadata records over the past year and also plotting that to collections, type, formats and partners. This will involve a bit of investigation of the dataset before we get to those numbers though.
Here is a quick warning about the rest of the post, for me I’m stepping out into deeper water for me with the analysis I’m going to be doing with our 94,222 edit events. From what I can tell from my research is that there are many ways to go about some of this and I’m not at all claiming that I have the best or even a good approach. But it has been fun so far.
Duration
The reason we wanted to capture event data when we created our Metadata Edit Event Service was to get a better idea of how much time our users were spending on the task of editing metadata records.
This is accomplished by adding a log value into the system with a timestamp, identifier, and username when a record is opened, and when the record is published back into the system the original log time is subtracted from the published time which results in the number of seconds that were taken for the metadata event. (a side note, this is also the basis for our record locking mechanism so that two users don’t try and edit the same record at the same time)
There are of course a number of issues with this model that we noticed, first what if the users opens a record and forgets about it and goes to lunch then comes back and publishes the record. What happens if they open a record and then close it, what happens to that previous log event, is it used the next time? What happens if a user opens multiple records at once in different tabs, if they aren’t using the other tabs immediately they are adding time without really “editing” the records. What if a user makes use of a browser automation tool like Selenium, won’t that skew your data?
The answer to many of these questions is “yep that happens” and how we deal with them in the data is something that I’m trying to figure out, I’ll walk you through what I’m doing so far to see if it makes sense.
Looking at the Data
Hours
As a reminder, there are 94,222 edit events in the dataset. The first thing I wanted to take a look at is how they group into buckets based on hours. I took the durations and divided them by 3600 with floor division so i should get buckets of 0,1,2,3,4,….and so on.
Below is a table of these values.
| Hours | Event Count |
| 0 | 93,378 |
| 1 | 592 |
| 2 | 124 |
| 3 | 41 |
| 4 | 20 |
| 5 | 5 |
| 6 | 8 |
| 7 | 7 |
| 8 | 1 |
| 9 | 4 |
| 10 | 6 |
| 11 | 2 |
| 12 | 1 |
| 14 | 3 |
| 16 | 5 |
| 17 | 3 |
| 18 | 2 |
| 19 | 1 |
| 20 | 1 |
| 21 | 2 |
| 22 | 2 |
| 23 | 2 |
| 24 | 3 |
| 25 | 1 |
| 26 | 1 |
| 29 | 1 |
| 32 | 2 |
| 37 | 1 |
| 40 | 2 |
| 119 | 1 |
And then a pretty graph of that same data.
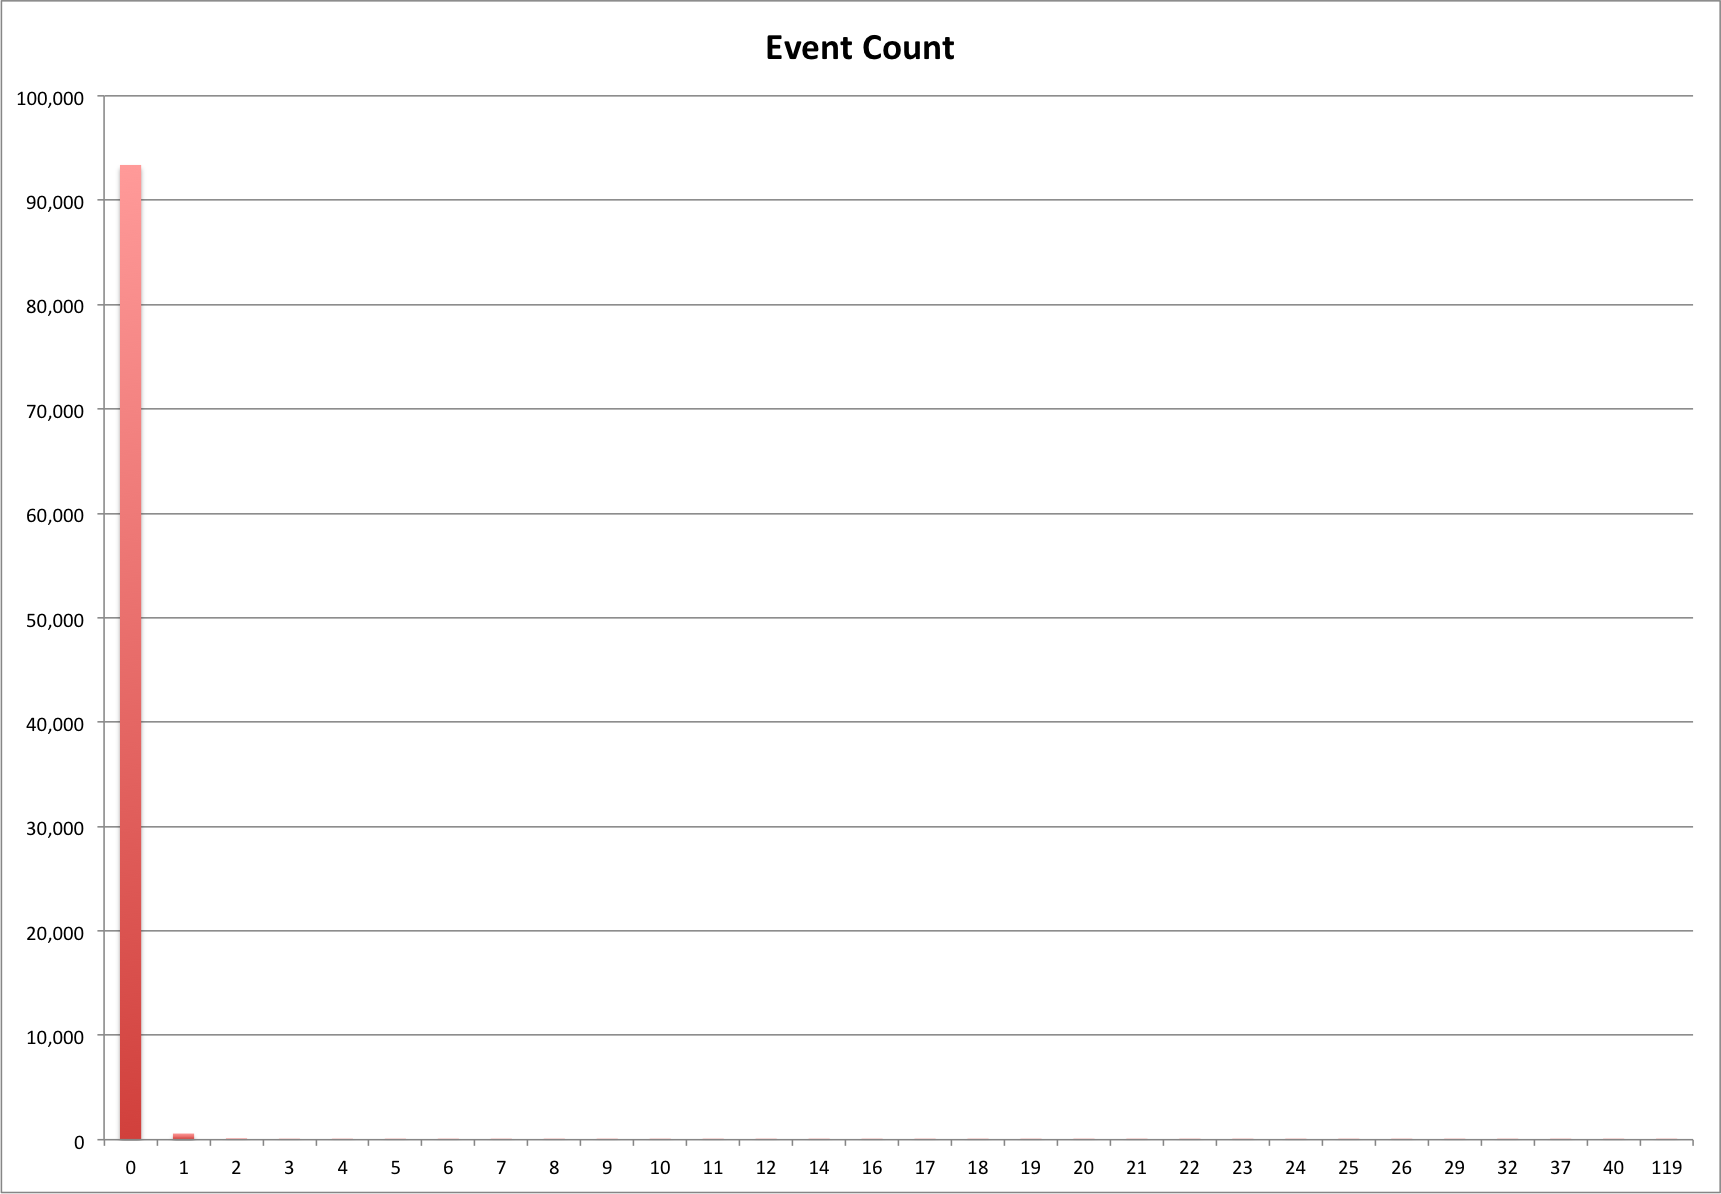
Edit Event durations grouped by hour
What is very obvious about this table and graph is that the vast majority with 93,378 (99%) of the edit events taking under one hour to finish. We already see some outliers with 119 hours (almost an entire work week.. that’s one tough record) on the top end of event duration list.
While I’m not going to get into it with this post, it would be interesting to see if there are any patterns to find in the 844 records that took longer than an hour to create. What percentage of that users records took over an hour, do they come from similar collections, types, formats, or partners? Something for later I guess.
Minutes
Next I wanted to look at the edit events that took less than an hour to complete, where do they sit if I put them in buckets based on 60 seconds. Filtering out the events that took more than an hour to complete leaves me 93,378 events. Below is the graph of these edit events.
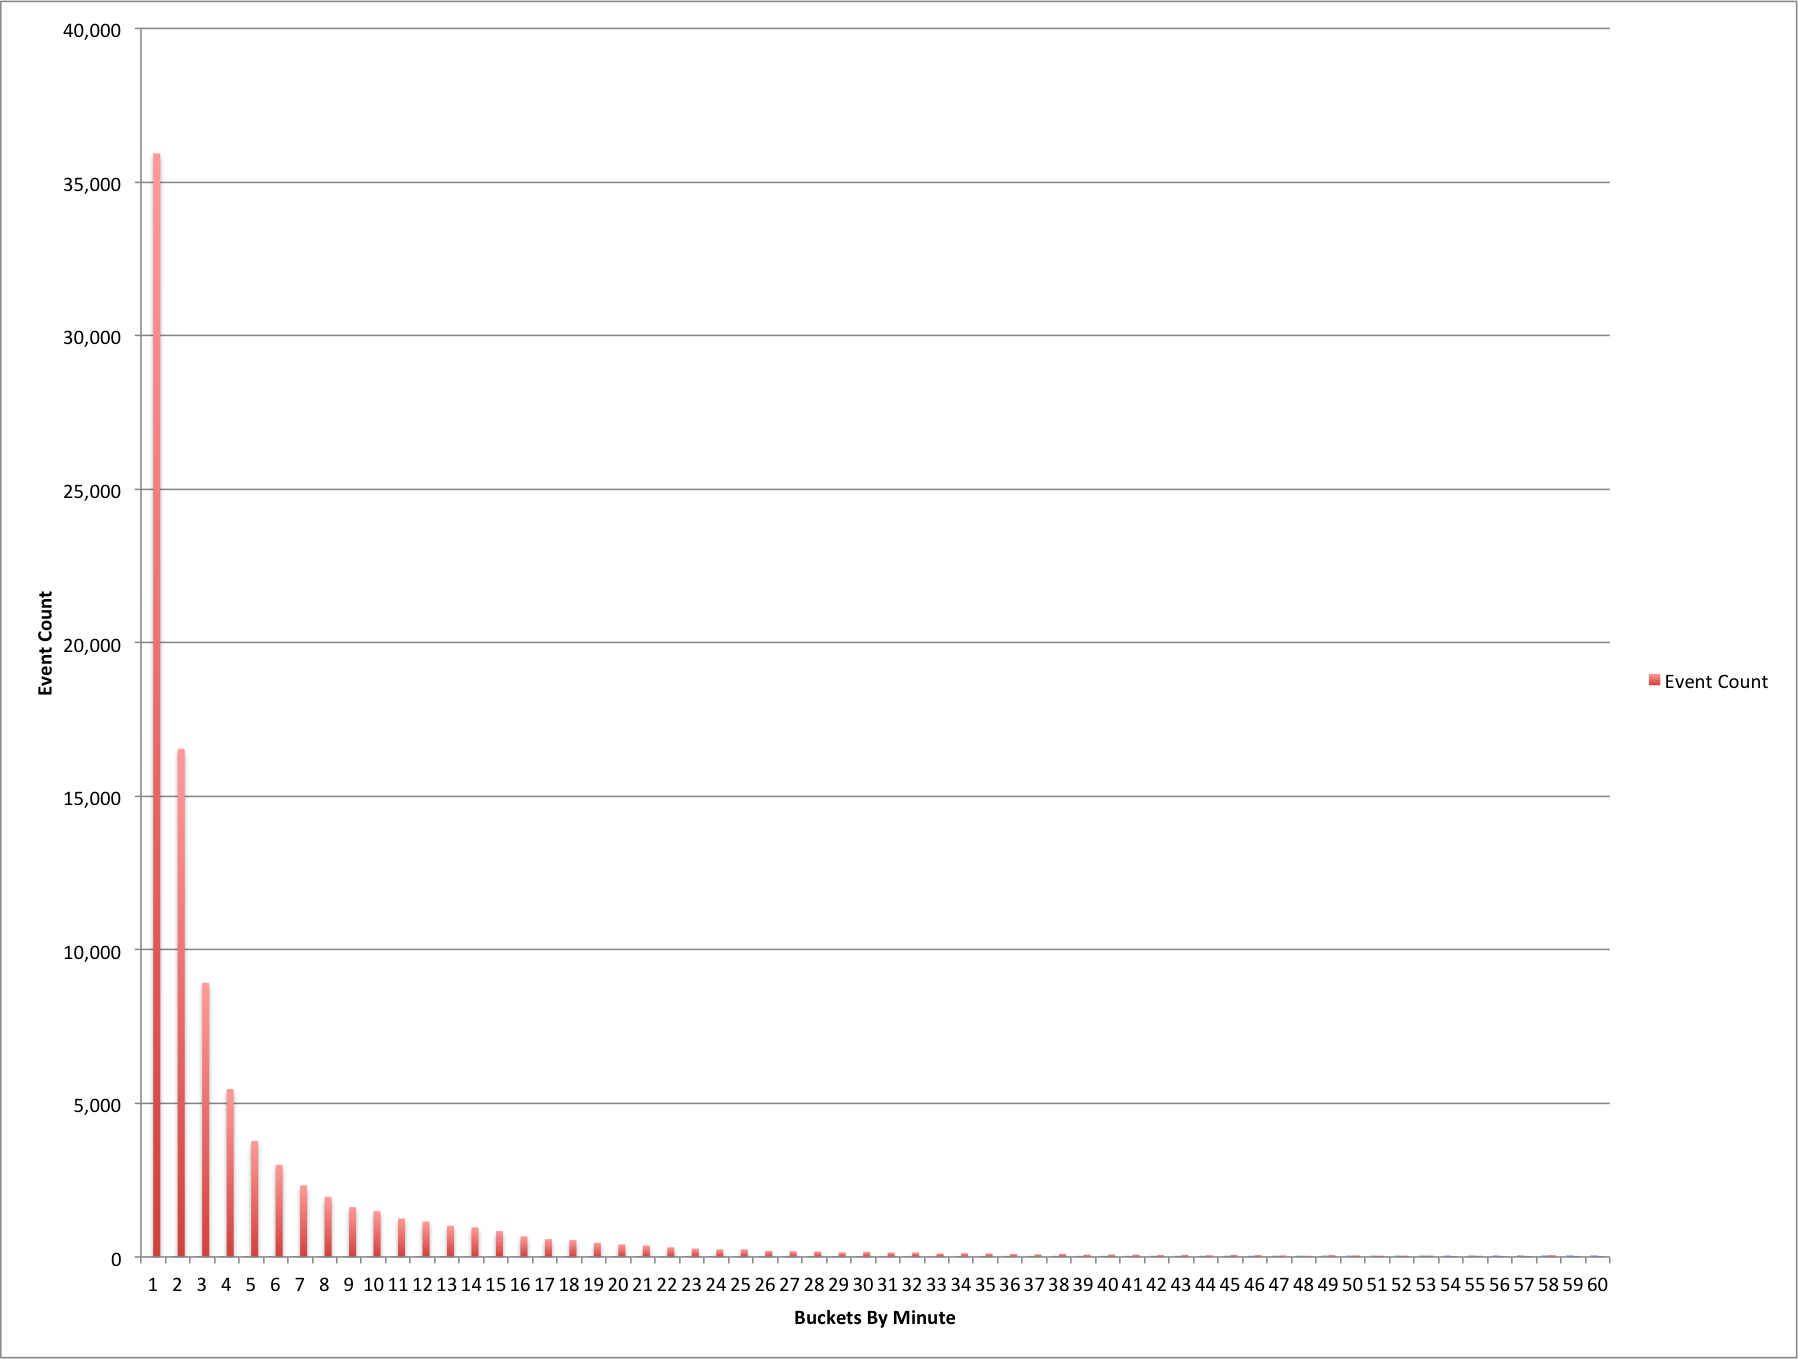
Edit Event durations grouped by minute for events taking under one hour to complete.
You can see a dramatic curve for the edit events as the number of minutes goes up.
I was interested to see where the 80/20 split for this dataset would be and it appears to be right about six minutes. There are 17,397 (19%) events occurring from 7-60 minutes and 75,981 (81%) events from 0-6 minutes in length.
Seconds
Diving into the dataset one more time I wanted to look at the 35,935 events that happened in less than a minute. Editing a record in under a minute for me takes a few different paths. First you could be editing a simple field like changing a language code or a resource type, second you could be just “looking” at a record and instead of closing the record you hit “publish” again. You might also be switching a record from the hidden state to the unhidden state (or vice versa), finally you might be using a browser automation tool to automate your edits. Let’s see if we can spot any of these actions when we look at the data.
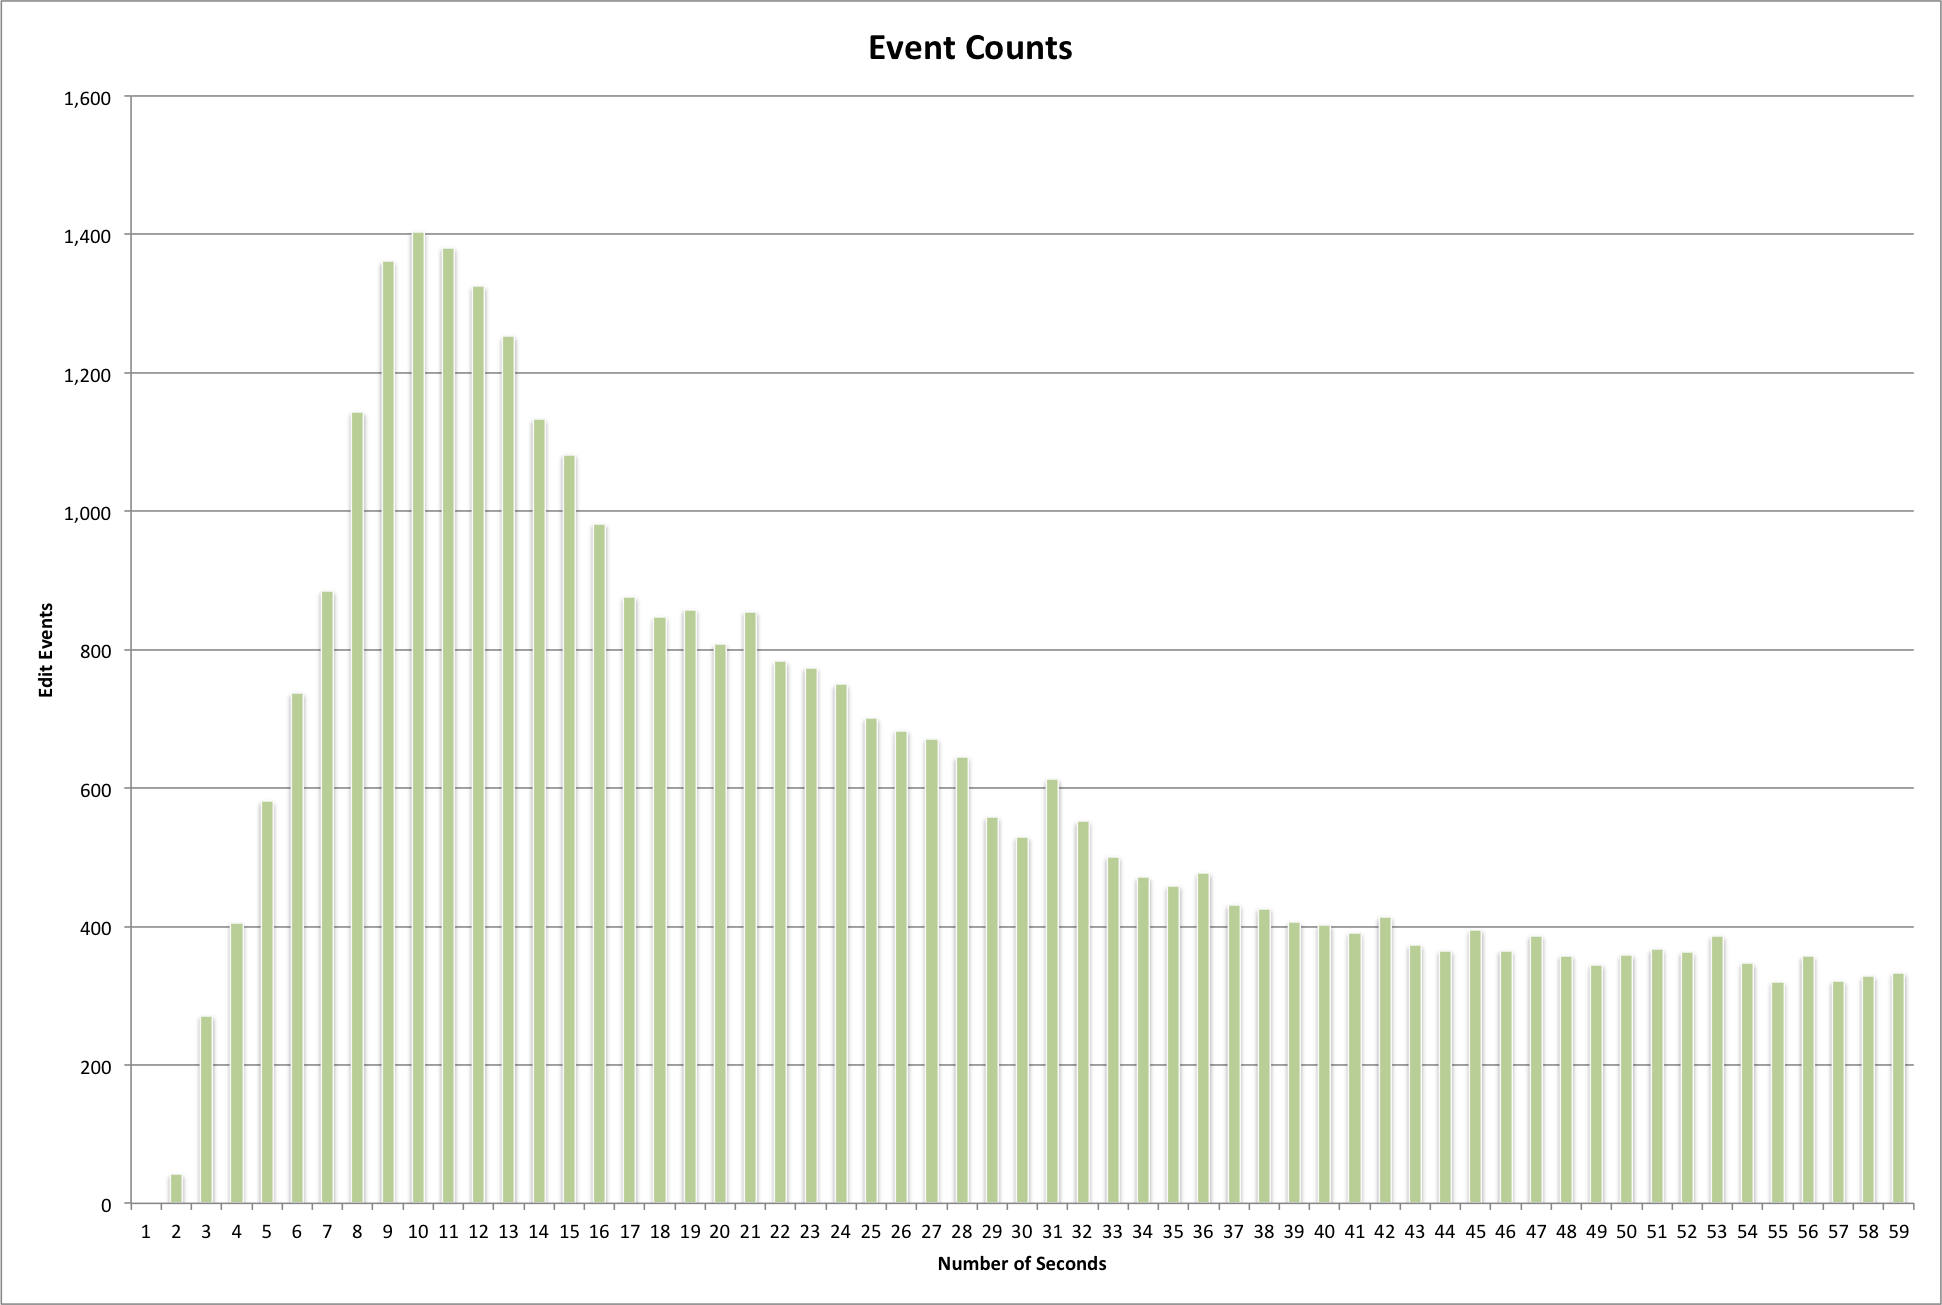
Edit Event durations for events taking under one minute to complete.
By just looking at the data above it is hard to say which of the kinds of events mentioned above map to different parts of the curve. I think when we start to look at individual users and collections some of this information might make a little more sense.
This is going to wrap up this post, in the next post I’m hoping to define the cutoff that will designate “outliers” from data that we want to use for the calculation of average times for metadata creation and then see how that looks for our various users in the system.
As always feel free to contact me via Twitter if you have questions or comments.