This is the sixth post in a series of posts related to metadata edit events for the UNT Libraries’ Digital Collections from January 1, 2014 to December 31, 2014. If you are interested in the previous posts in this series, they talked about the when, what, who, duration based on time buckets and finally calculating the average edit event time.
In the previous post I was able to come up with what I’m using as the edit event duration ceiling for the rest of this analysis. This means that the rest of the analysis in this post will ignore the events that took longer than 2,100 seconds this leaves us with 91,916 (or 97.6% of the original dataset) valid events to analyze after removing 2,306 that had a duration of over 2,100.
Editors
The table below is the user stats for our top ten editors once I’ve ignored items over 2,100 seconds.
| username | min | max | edit events | duration sum | mean | stddev |
| htarver | 2 | 2,083 | 15,346 | 1,550,926 | 101.06 | 132.59 |
| aseitsinger | 3 | 2,100 | 9,750 | 3,920,789 | 402.13 | 437.38 |
| twarner | 5 | 2,068 | 4,627 | 184,784 | 39.94 | 107.54 |
| mjohnston | 3 | 1,909 | 4,143 | 562,789 | 135.84 | 119.14 |
| atraxinger | 3 | 2,099 | 3,833 | 1,192,911 | 311.22 | 323.02 |
| sfisher | 5 | 2,084 | 3,434 | 468,951 | 136.56 | 241.99 |
| cwilliams | 4 | 2,095 | 3,254 | 851,369 | 261.64 | 340.47 |
| thuang | 4 | 2,099 | 3,010 | 770,836 | 256.09 | 397.57 |
| mphillips | 3 | 888 | 2,669 | 57,043 | 21.37 | 41.32 |
| sdillard | 3 | 2,052 | 2,516 | 1,599,329 | 635.66 | 388.3 |
You can see that many of these users have very short edit times for their lowest edits and all but one have edit times for the maximum that approach the duration ceiling. The average amount of time spent per edit event ranges from 21 seconds to 10 minutes and 35 seconds.
I know that for user mphillips (me) the bulk of the work I tend to do in the edit system is fixing quick mistakes like missing language codes, editing dates that aren’t in Extended Data Time Format (EDTF) or hiding and un-hiding records. Other users such as sdillard have been working exclusively on a project to create metadata for a collection of Texas Patents that we are describing in the Portal.
Collections
The top ten most edited collections and their statistics are presented below.
| Collection Code | Collection Name | min | max | edit events | duration sum | mean | stddev |
| ABCM | Abilene Library Consortium | 2 | 2,083 | 8,418 | 1,358,606 | 161.39 | 240.36 |
| JBPC | Jim Bell Texas Architecture Photograph Collection | 3 | 2,100 | 5,335 | 2,576,696 | 482.98 | 460.03 |
| JJHP | John J. Herrera Papers | 3 | 2,095 | 4,940 | 1,358,375 | 274.97 | 346.46 |
| ODNP | Oklahoma Digital Newspaper Program | 5 | 2,084 | 3,946 | 563,769 | 142.87 | 243.83 |
| OKPCP | Oklahoma Publishing Company Photography Collection | 4 | 2,098 | 5,692 | 869,276 | 152.72 | 280.99 |
| TCO | Texas Cultures Online | 3 | 2,095 | 5,221 | 1,406,347 | 269.36 | 343.87 |
| TDNP | Texas Digital Newspaper Program | 2 | 1,989 | 7,614 | 1,036,850 | 136.18 | 185.41 |
| TLRA | Texas Laws and Resolutions Archive | 3 | 2,097 | 8,600 | 1,050,034 | 122.1 | 172.78 |
| TXPT | Texas Patents | 2 | 2,099 | 6,869 | 3,740,287 | 544.52 | 466.05 |
| TXSAOR | Texas State Auditor’s Office: Reports | 3 | 1,814 | 2,724 | 428,628 | 157.35 | 142.94 |
| UNTETD | UNT Theses and Dissertations | 5 | 2,098 | 4,708 | 1,603,857 | 340.67 | 474.53 |
| UNTPC | University Photography Collection | 3 | 2,096 | 4,408 | 1,252,947 | 284.24 | 340.36 |
This data is a little easier to see with a graph.
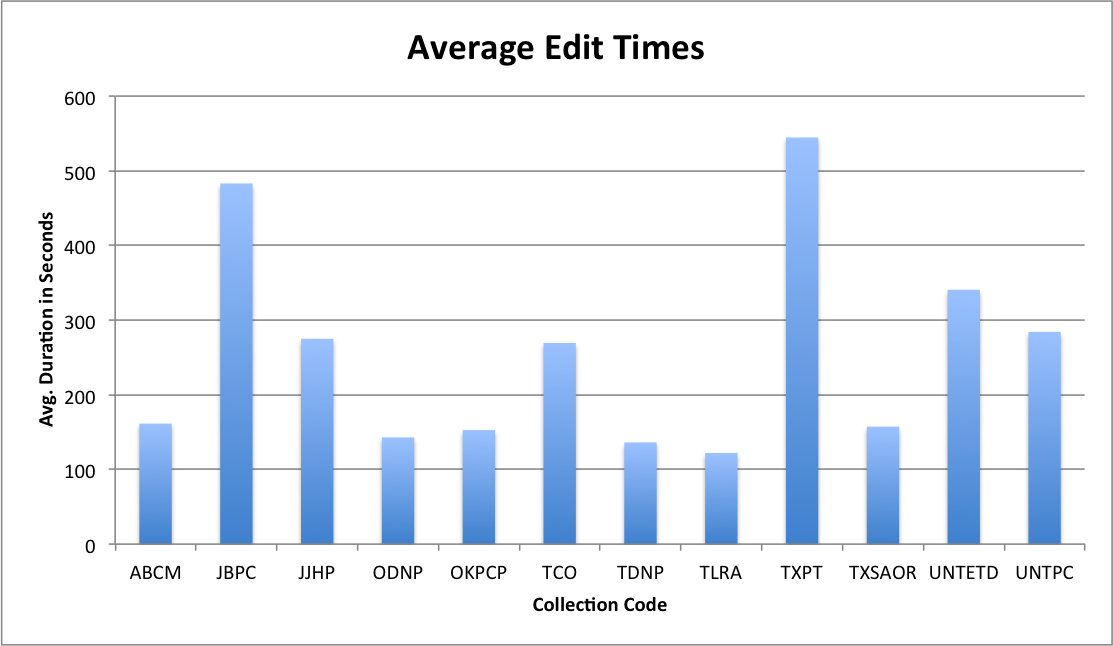
Average edit duration per collection
Here is my interpretation of what I see in these numbers based on personal knowledge of these collections.
The collections with the highest average duration are the TXPT and JBPC collection, these are followed by the UNTETD, UNTPC, TCP and JJHP collections. The first two (Texas Patents (TXPT) and Jim Bell Texas Architecture Photograph Collection (JBPC) are example of collections that were having metadata records created for the first time via our online editing system. These collections generally required more investigation (either by reading the patent or researching the photograph) and therefore took more time on average to create the records.
Two of the others, the UNT Theses and Dissertation Collection (UNTETD) and the UNT Photography Collection (UNTPC) involved an amount of copy cataloging for the creation of the metadata either from existing MARC records or local finding aids. TheJohn J. Herrera Papers (JJHP) involved, I believe, a working with an existing finding aid, and I know that there was a two step process of creating the record, and then publishing it as unhidden in a different event, therefore lowering the average time considerably. I don’t know that much about the Texas Cultures Online (TCO) work in 2014 to be able to comment there.
On the other end of of the spectrum you have collections like ABCM, ODNP, OKPCP, and TDNP that were projects that averaged a much shorter amount of time on records. For these there were many small edits to the records that were typically completed one field at a time. For some of these it might have just involved fixing a consistent typo, adding the record to a collection or hiding or un-hiding it from public view.
This raises a question for me, is it possible to detect the “kind” of edits that are being made based on their average edit times? That’s something to look at.
Partner Institutions
And now the ten partner institutions that had the most metadata edit events.
| Partner Code | Partner Name | min | max | edit events | duration sum | mean | stddev |
| UNTGD | UNT Libraries Government Documents Department | 2 | 2,099 | 21,342 | 5,385,000 | 252.32 | 356.43 |
| OKHS | Oklahoma Historical Society | 4 | 2,098 | 10,167 | 1,590,498 | 156.44 | 279.95 |
| UNTA | UNT Libraries Special Collections | 3 | 2,099 | 9,235 | 2,664,036 | 288.47 | 362.34 |
| UNT | UNT Libraries | 2 | 2,098 | 6,755 | 2,051,851 | 303.75 | 458.03 |
| PCJB | Private Collection of Jim Bell | 3 | 2,100 | 5,335 | 2,576,696 | 482.98 | 460.03 |
| HMRC | Houston Metropolitan Research Center at Houston Public Library | 3 | 2,095 | 5,127 | 1,397,368 | 272.55 | 345.62 |
| HPUL | Howard Payne University Library | 2 | 1,860 | 4,528 | 544,420 | 120.23 | 113.97 |
| UNTCVA | UNT College of Visual Arts + Design | 4 | 2,098 | 4,169 | 1,015,882 | 243.68 | 364.92 |
| HSUL | Hardin-Simmons University Library | 3 | 2,020 | 2,706 | 658,600 | 243.39 | 361.66 |
| HIGPL | Higgins Public Library | 2 | 1,596 | 1,935 | 131,867 | 68.15 | 118.5 |
Again presented as a simple chart.
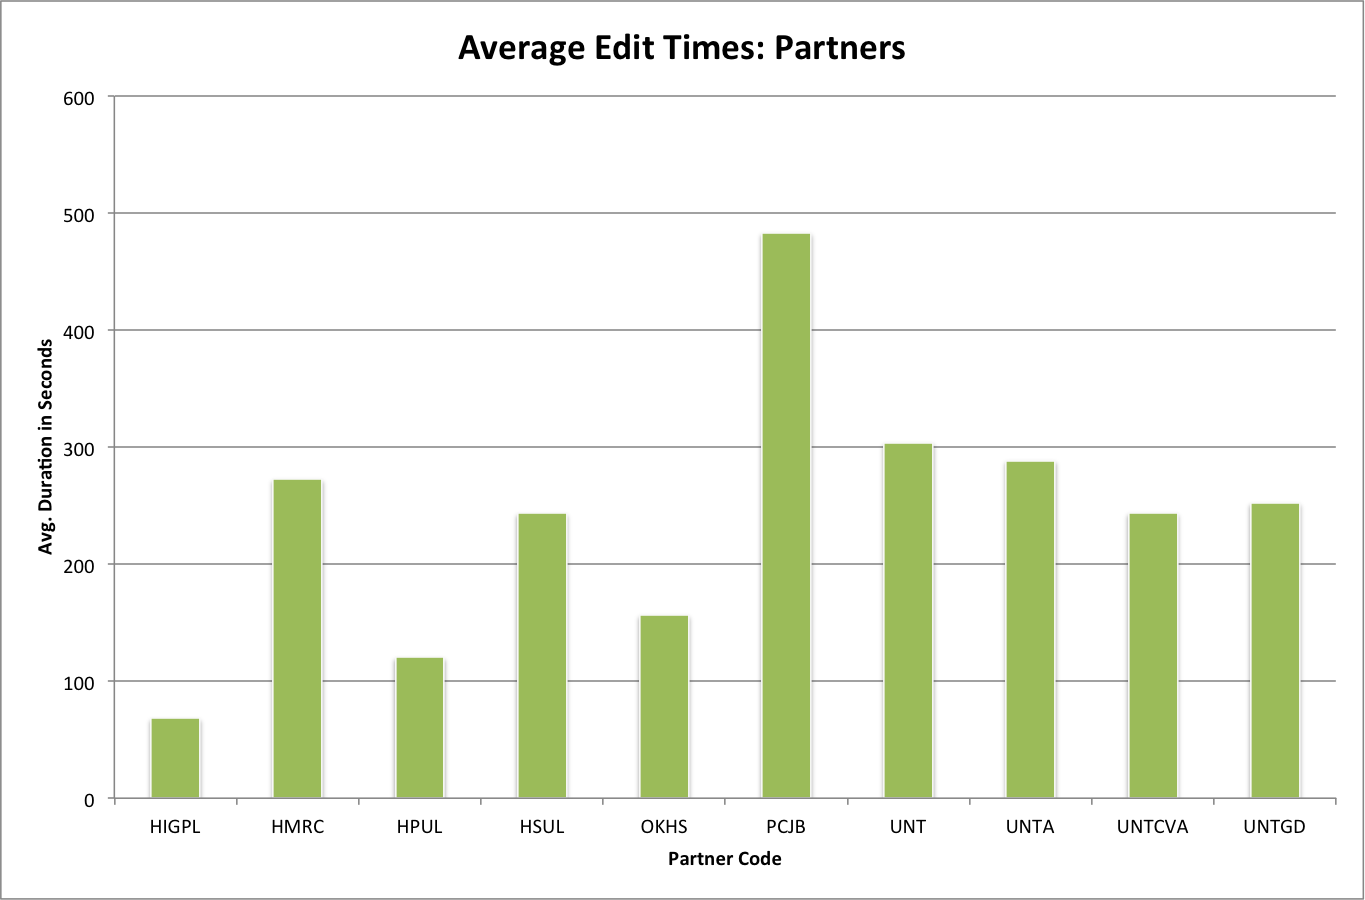
Average edit duration per partner.
It is easy to see the difference between the Private Collection of Jim Bell (PCJB) with an average of 482 seconds or roughly 8 minutes per edit and the Higgins Public Library (HIGPL) which had an average of 68 seconds, or just over one minute. In the first case with the Private Collection of Jim Bell (PCJB), we were active in creating records for the first time for these items and the average of eight minutes seems to track with what one would imagine it takes to create a metadata record for a photograph. The Higgins Public Library (HIGPL) collection is a newspaper collection that had a single change in the physical description made to all of the items in that partner’s collection. Other partners between these two extremes and have similar characteristics with the lower edit averages happening for partner’s content that is either being edited in a small way, hidden or un-hidden from view.
Resource Type
The final way we will slice the data for this post is by looking at the stats for the top ten resource types.
| resource type | min | max | count | sum | mean | stddev |
| image_photo | 2 | 2,100 | 30,954 | 7,840,071 | 253.28 | 356.43 |
| text_newspaper | 2 | 2,084 | 11,546 | 1,600,474 | 138.62 | 207.3 |
| text_leg | 3 | 2,097 | 8,604 | 1,050,103 | 122.05 | 172.75 |
| text_patent | 2 | 2,099 | 6,955 | 3,747,631 | 538.84 | 466.25 |
| physical-object | 2 | 2,098 | 5,479 | 1,102,678 | 201.26 | 326.21 |
| text_etd | 5 | 2,098 | 4,713 | 1,603,938 | 340.32 | 474.4 |
| text | 3 | 2,099 | 4,196 | 1,086,765 | 259 | 349.67 |
| text_letter | 4 | 2,095 | 4,106 | 1,118,568 | 272.42 | 326.09 |
| image_map | 3 | 2,034 | 3,480 | 673,707 | 193.59 | 354.19 |
| text_report | 3 | 1,814 | 3,339 | 465,168 | 139.31 | 145.96 |
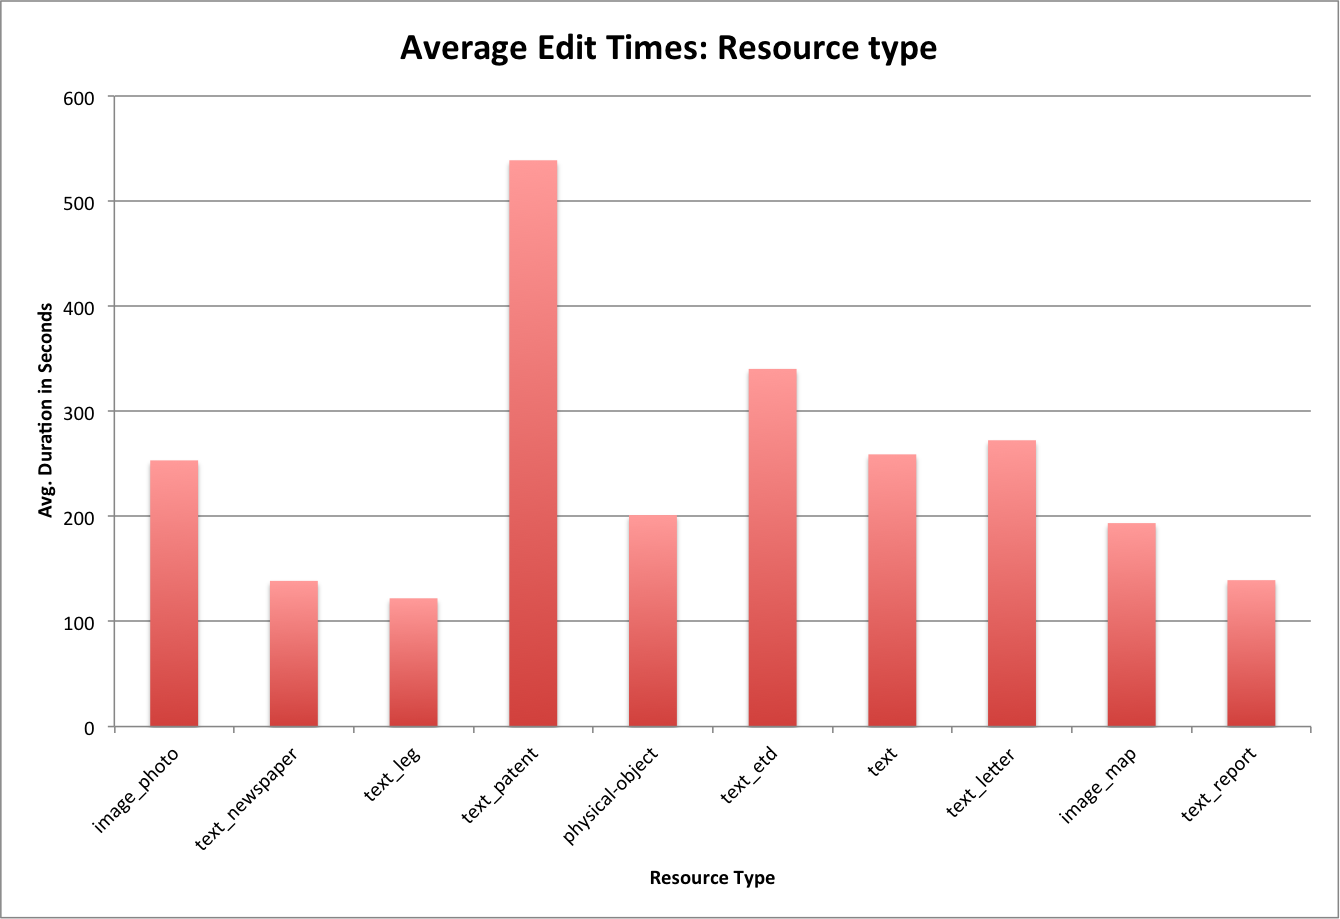
Average edit duration for the top ten resource types
The resource type that really stands out in this graph is the text_patents at 538 seconds per record. These items belong to the Texas Patent Collection and they were loaded into the system with very minimal records and we have been working to add new metadata to these resources. The almost ten minutes per record seems to be very standard for the amount of work that is being done with the records.
The text_leg collection is one that I wanted to take another quick look at.
If we calculate the statistics for the users that edited records in this collection we get the following data.
| username | min | max | count | sum | mean | stddev |
| bmonterroso | 3 | 1,825 | 890 | 85,254 | 95.79 | 163.25 |
| htarver | 9 | 23 | 5 | 82 | 16.4 | 5.64 |
| mjohnston | 3 | 1,909 | 3,309 | 329,585 | 99.6 | 62.08 |
| mphillips | 5 | 33 | 30 | 485 | 16.17 | 7.68 |
| rsittel | 3 | 1,436 | 654 | 22,168 | 33.9 | 88.71 |
| tharden | 3 | 2,097 | 1,143 | 213,817 | 187.07 | 241.2 |
| thuang | 4 | 1,812 | 2,573 | 398,712 | 154.96 | 227.7 |
Again you really see it with the graph.
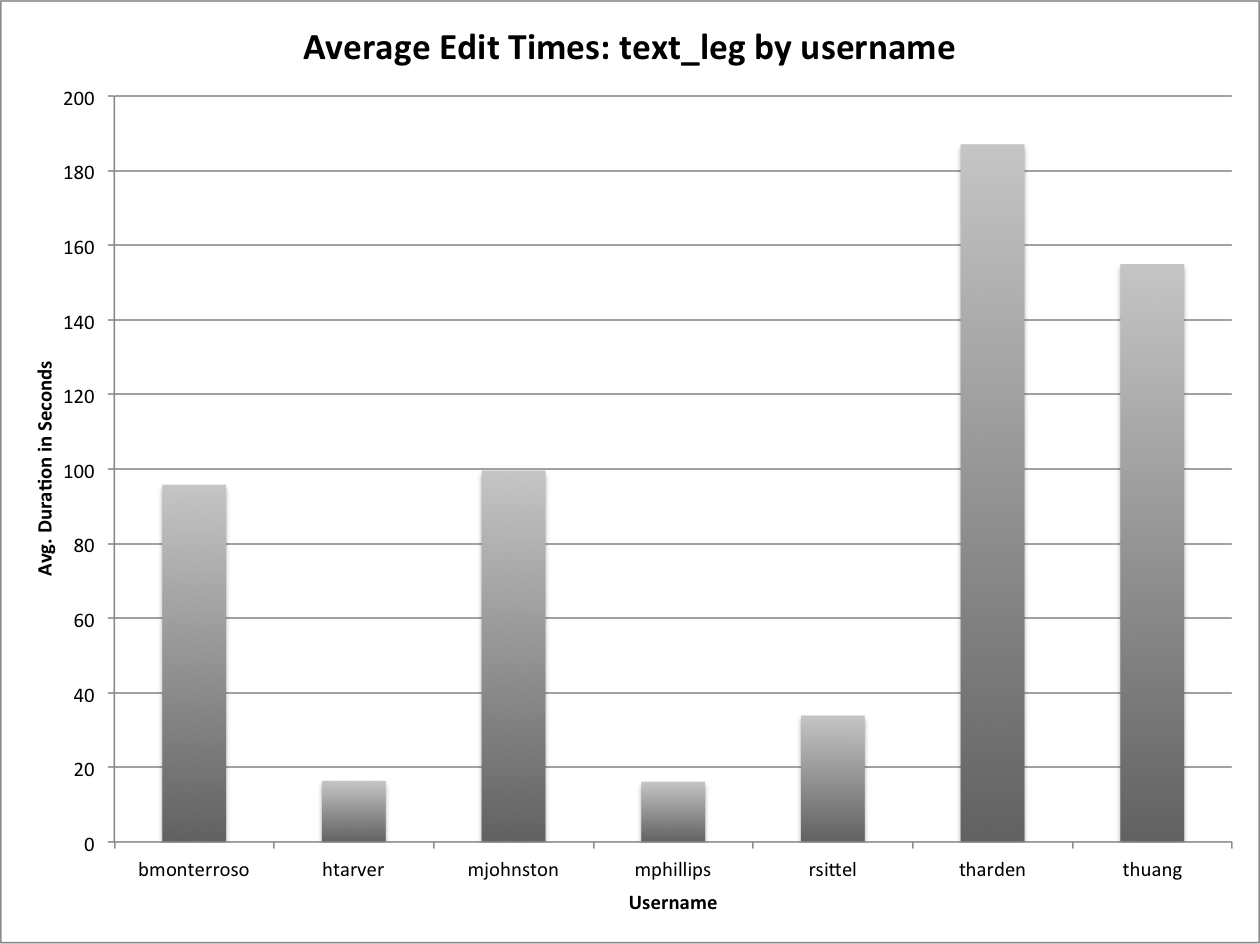
Average edit duration for users who edited records that were the text_leg resource type
In this you see that there were a few users (htarver, mphillips, rsittel) who brought down the average duration because they had very quick edits while the rest of the editors either averaged right around 100 seconds per edit average or around two minutes per edit average.
I think that there is more to do with these numbers, I think calculating the average total duration for a given metadata record in the system as edits are performed on it will be something of interest for a later post. So check back for the next post in this series.
As always feel free to contact me via Twitter if you have questions or comments.