There are still a few things that I have been wanting to do with the subject data from the DPLA dataset that I’ve been working with for the past few months.
This time I wanted to take a look at some of the characteristics of the subject strings themselves and see if there is any information there that is helpful, useful for us to look at as an indicator of quality for the metadata record associated with that subject.
I took at look at the following metrics for each subject string; length, percentage integer, number of tokens, length of anagram, anagram complexity, number of non-alphanumeric characters (punctuation).
In the tables below I present a few of the more interesting selections from the data.
Subject Length
This is calculated by stripping whitespace from the ends of each subject, and then counting the number of characters that are left in the string.
| Hub | Unique Subjects | Minimum Length | Median Length | Maximum Length | Average Length | stddev |
| ARTstor | 9,560 | 3 | 12.0 | 201 | 16.6 | 14.4 |
| Biodiversity_Heritage_Library | 22,004 | 3 | 10.5 | 478 | 16.4 | 10.0 |
| David_Rumsey | 123 | 3 | 18.0 | 30 | 11.3 | 5.2 |
| Digital_Commonwealth | 41,704 | 3 | 17.5 | 3490 | 19.6 | 26.7 |
| Digital_Library_of_Georgia | 132,160 | 3 | 18.5 | 169 | 27.1 | 14.1 |
| Harvard_Library | 9,257 | 3 | 17.0 | 110 | 30.2 | 12.6 |
| HathiTrust | 685,733 | 3 | 31.0 | 728 | 36.8 | 16.6 |
| Internet_Archive | 56,910 | 3 | 152.0 | 1714 | 38.1 | 48.4 |
| J._Paul_Getty_Trust | 2,777 | 4 | 65.0 | 99 | 31.6 | 15.5 |
| Kentucky_Digital_Library | 1,972 | 3 | 31.5 | 129 | 33.9 | 18.0 |
| Minnesota_Digital_Library | 24,472 | 3 | 19.5 | 199 | 17.4 | 10.2 |
| Missouri_Hub | 6,893 | 3 | 182.0 | 525 | 30.3 | 40.4 |
| Mountain_West_Digital_Library | 227,755 | 3 | 12.0 | 3148 | 27.2 | 25.1 |
| National_Archives_and_Records_Administration | 7,086 | 3 | 19.0 | 166 | 22.7 | 17.9 |
| North_Carolina_Digital_Heritage_Center | 99,258 | 3 | 9.5 | 3192 | 25.6 | 20.2 |
| Smithsonian_Institution | 348,302 | 3 | 14.0 | 182 | 24.2 | 11.9 |
| South_Carolina_Digital_Library | 23,842 | 3 | 26.5 | 1182 | 35.7 | 25.9 |
| The_New_York_Public_Library | 69,210 | 3 | 29.0 | 119 | 29.4 | 13.5 |
| The_Portal_to_Texas_History | 104,566 | 3 | 16.0 | 152 | 17.7 | 9.7 |
| United_States_Government_Printing_Office_(GPO) | 174,067 | 3 | 39.0 | 249 | 43.5 | 18.1 |
| University_of_Illinois_at_Urbana-Champaign | 6,183 | 3 | 23.0 | 141 | 23.2 | 14.3 |
| University_of_Southern_California._Libraries | 65,958 | 3 | 13.5 | 211 | 18.4 | 10.7 |
| University_of_Virginia_Library | 3,736 | 3 | 40.5 | 102 | 31.0 | 17.7 |
My takeaway from this is that three characters long is just about the shortest subject that one is able to include, not the absolute rule, but that is the low end for this data.
The average length ranges from 11.3 average characters for the David Rumsey hub to 43.5 characters on average for the United States Government Printing Office (GPO).
Put into a graph you can see the average subject length across the Hubs a bit easier.
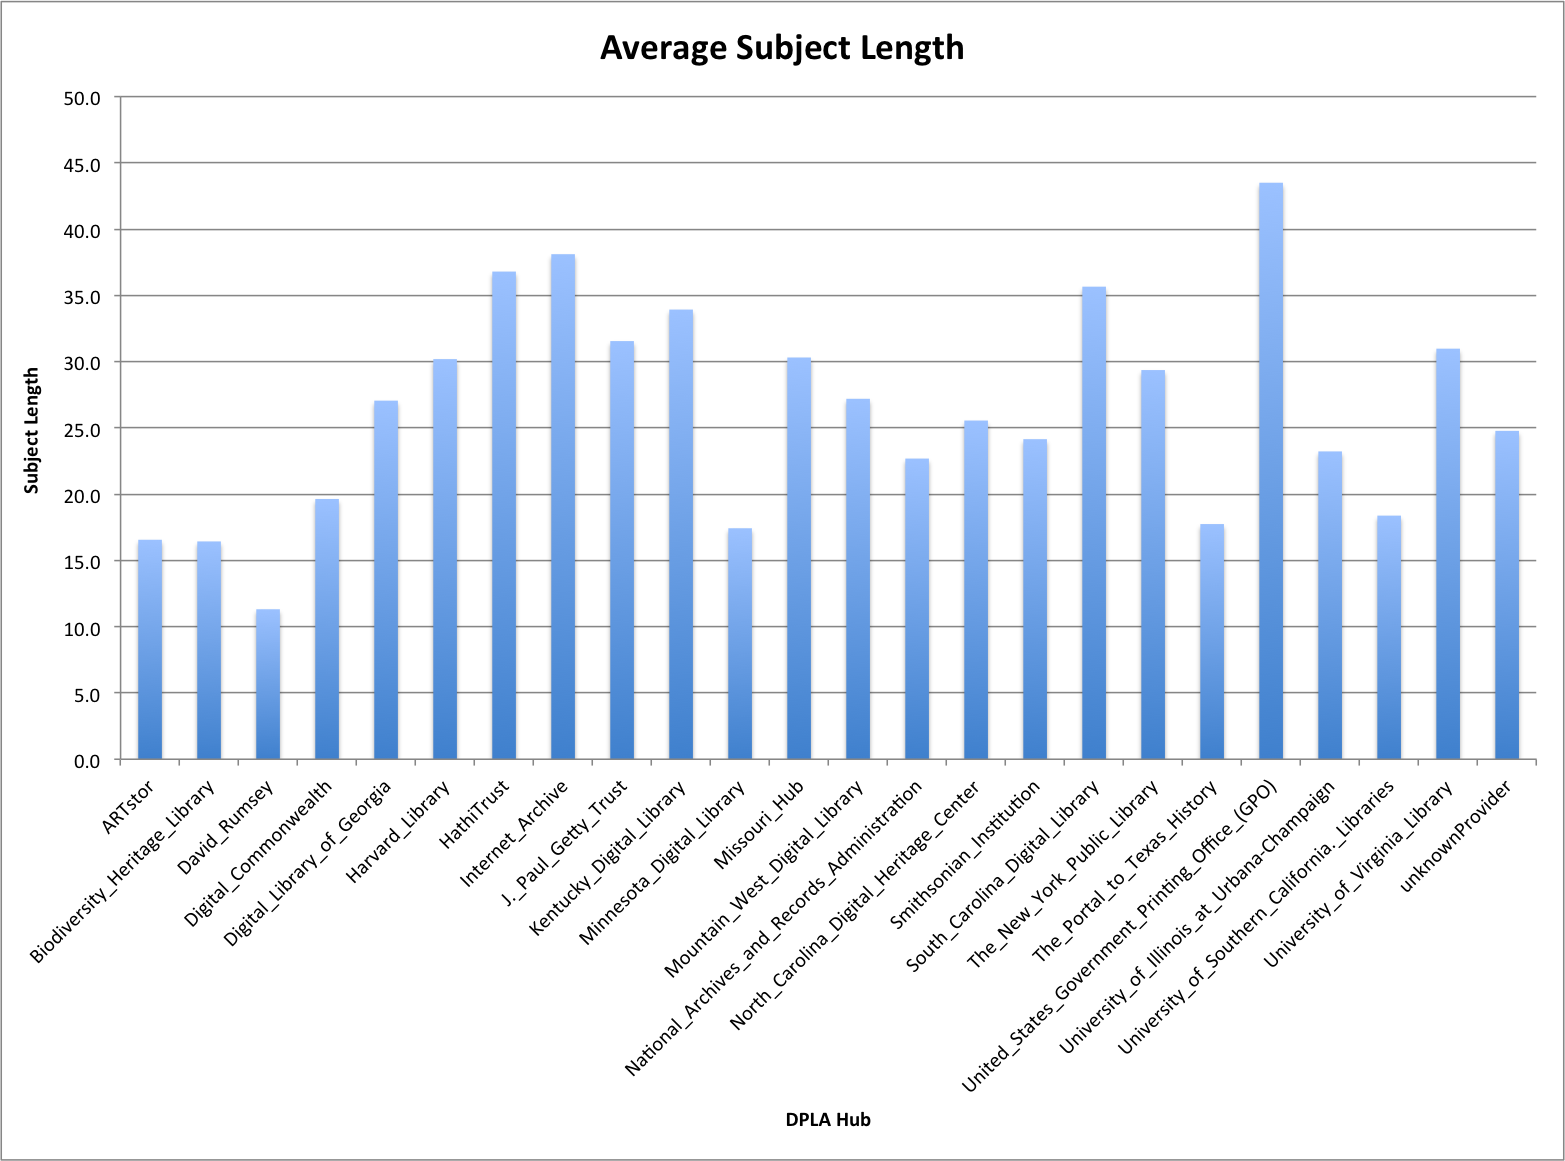
Average Subject Length
The length of a field can be helpful to find values that are a bit outside of the norm. For example you can see that there are five Hubs that have maximum character lengths of over 1,000 characters. In a quick investigation of these values they appear to be abstracts and content descriptions accidentally coded as a subject.
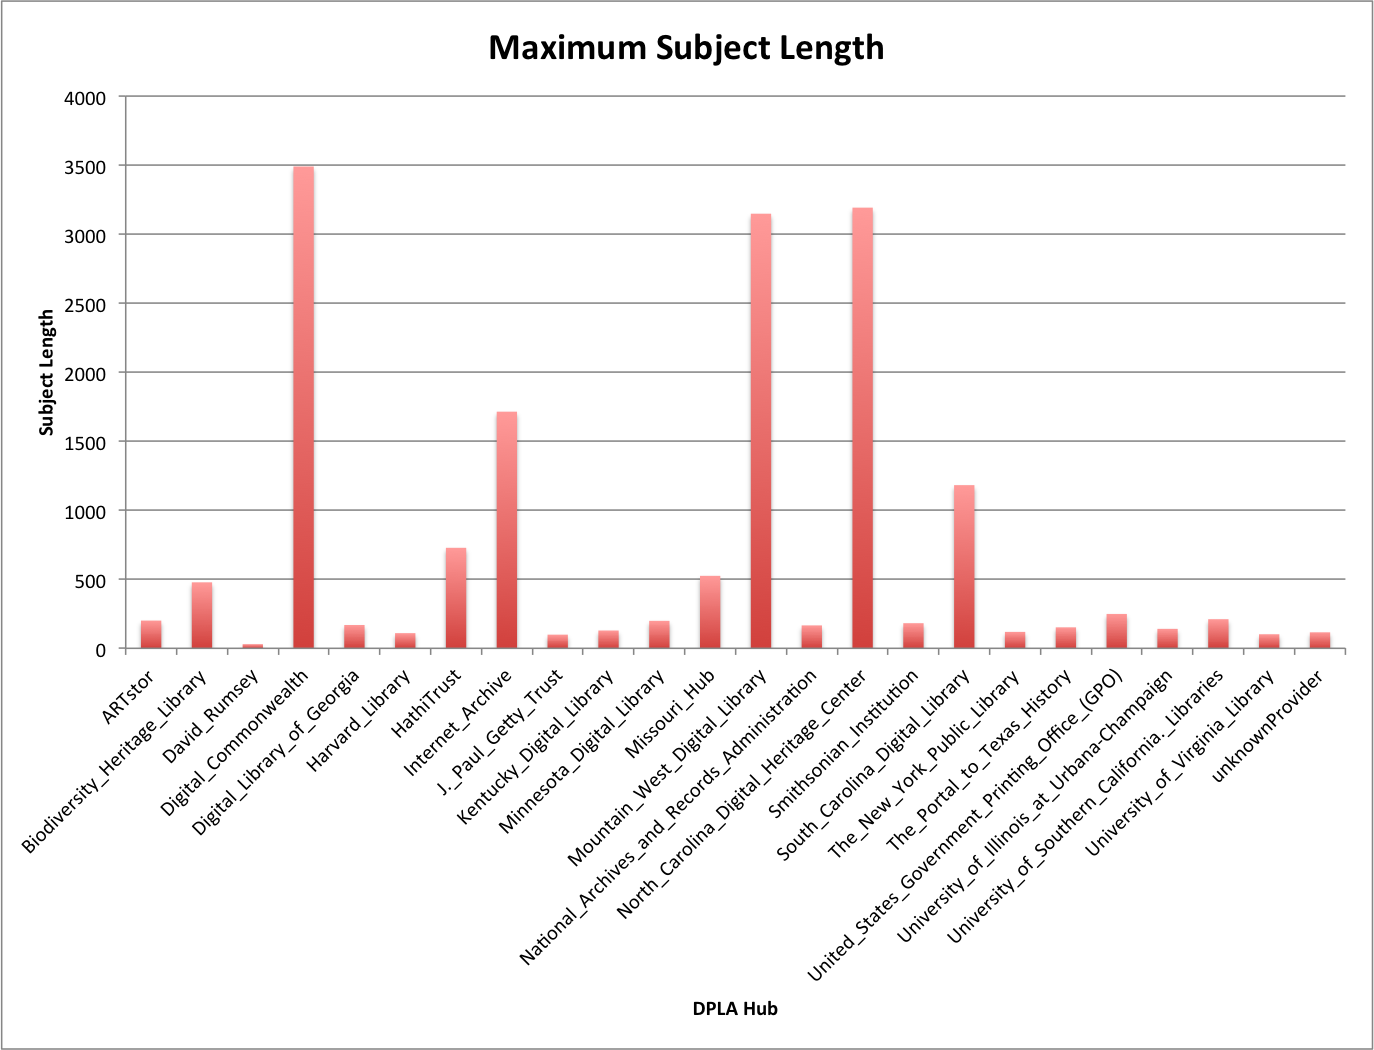
Maximum Subject Length
For the Portal to Texas History that had a few subjects that came in at over 152 characters long, it turns out that these are incorrectly formatted subject fields where a user has included a number of subjects in one field instead of separating them out into multiple fields.
Percent Integer
For this metric I stripped whitespace characters, and then divided the number of digit characters by the number of total characters in the string to come up with the percentage integer.
| Hub | Unique Subjects | Maximum % Integer | Average % Integer | stddev |
| ARTstor | 9,560 | 61.5 | 1.3 | 5.2 |
| Biodiversity_Heritage_Library | 22,004 | 92.3 | 2.2 | 11.1 |
| David_Rumsey | 123 | 36.4 | 0.5 | 4.2 |
| Digital_Commonwealth | 41,704 | 66.7 | 1.6 | 6.0 |
| Digital_Library_of_Georgia | 132,160 | 87.5 | 1.7 | 6.2 |
| Harvard_Library | 9,257 | 44.4 | 4.6 | 9.0 |
| HathiTrust | 685,733 | 100.0 | 3.5 | 8.4 |
| Internet_Archive | 56,910 | 100.0 | 4.1 | 9.4 |
| J._Paul_Getty_Trust | 2,777 | 50.0 | 3.6 | 8.0 |
| Kentucky_Digital_Library | 1,972 | 63.6 | 5.7 | 9.9 |
| Minnesota_Digital_Library | 24,472 | 80.0 | 1.1 | 5.1 |
| Missouri_Hub | 6,893 | 50.0 | 2.9 | 7.5 |
| Mountain_West_Digital_Library | 227,755 | 100.0 | 1.1 | 5.5 |
| National_Archives_and_Records_Administration | 7,086 | 42.1 | 4.7 | 9.4 |
| North_Carolina_Digital_Heritage_Center | 99,258 | 100.0 | 1.5 | 5.9 |
| Smithsonian_Institution | 348,302 | 100.0 | 1.1 | 3.6 |
| South_Carolina_Digital_Library | 23,842 | 57.1 | 2.3 | 6.5 |
| The_New_York_Public_Library | 69,210 | 100.0 | 12.0 | 13.5 |
| The_Portal_to_Texas_History | 104,566 | 100.0 | 0.4 | 3.7 |
| United_States_Government_Printing_Office_(GPO) | 174,067 | 80.0 | 0.4 | 2.4 |
| University_of_Illinois_at_Urbana-Champaign | 6,183 | 50.0 | 6.1 | 10.9 |
| University_of_Southern_California._Libraries | 65,958 | 100.0 | 1.3 | 6.4 |
| University_of_Virginia_Library | 3,736 | 72.7 | 1.8 | 6.8 |
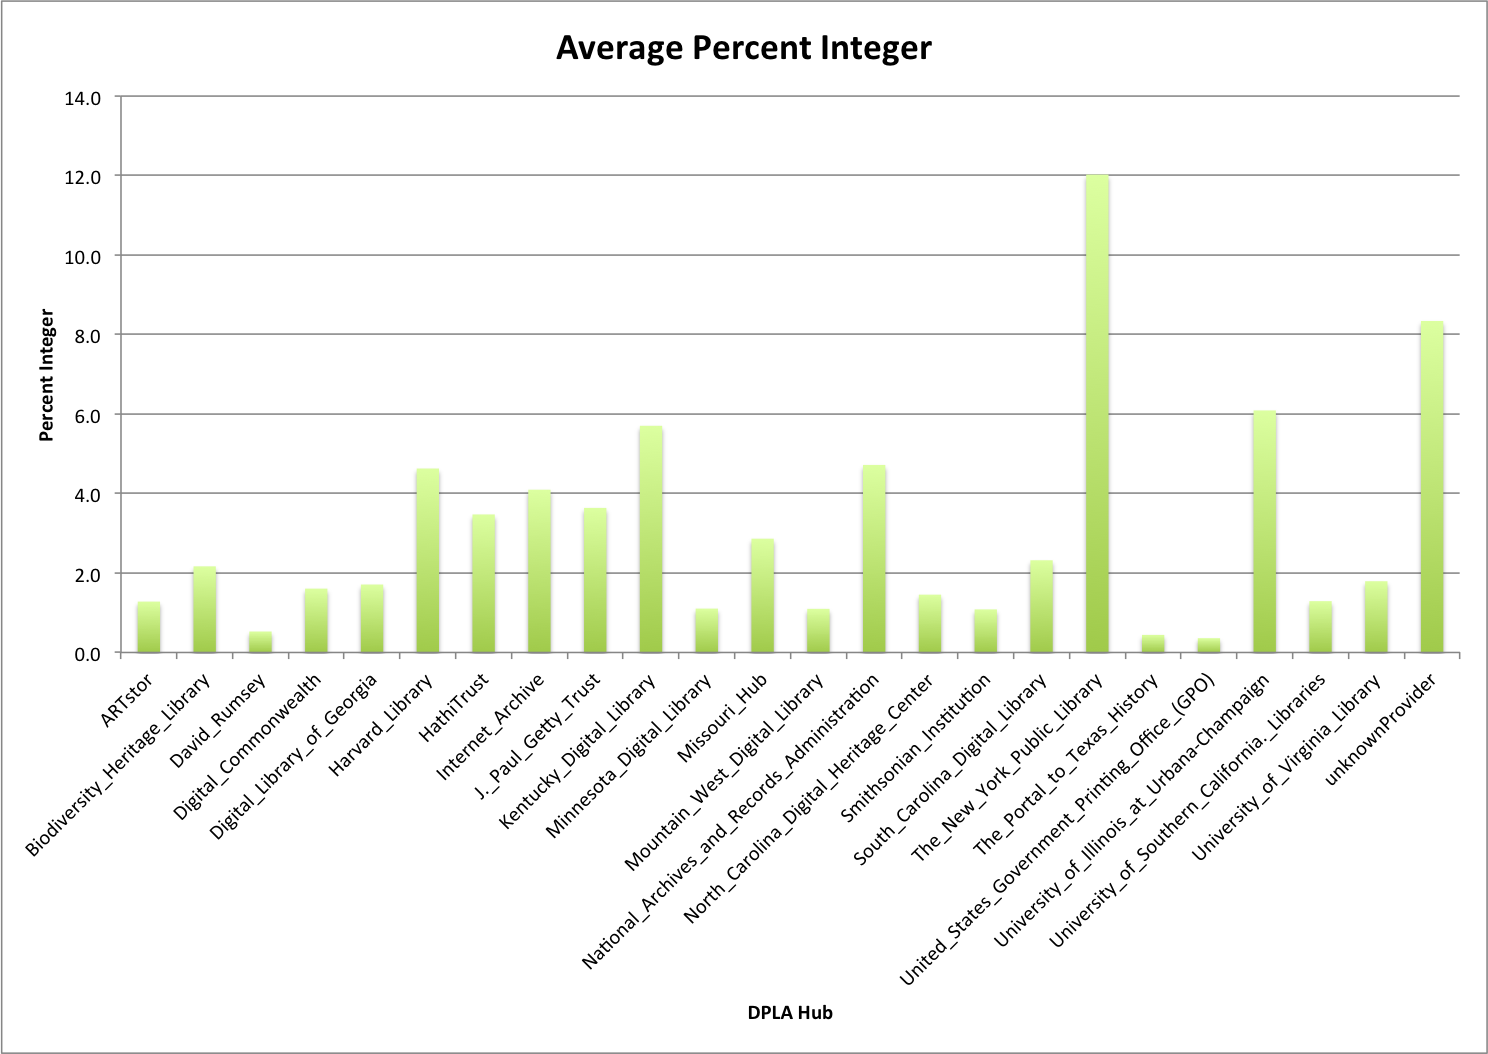
Average Percent Integer
If you group these into the Content-Hub and Service-Hub categories you can see things a little better.
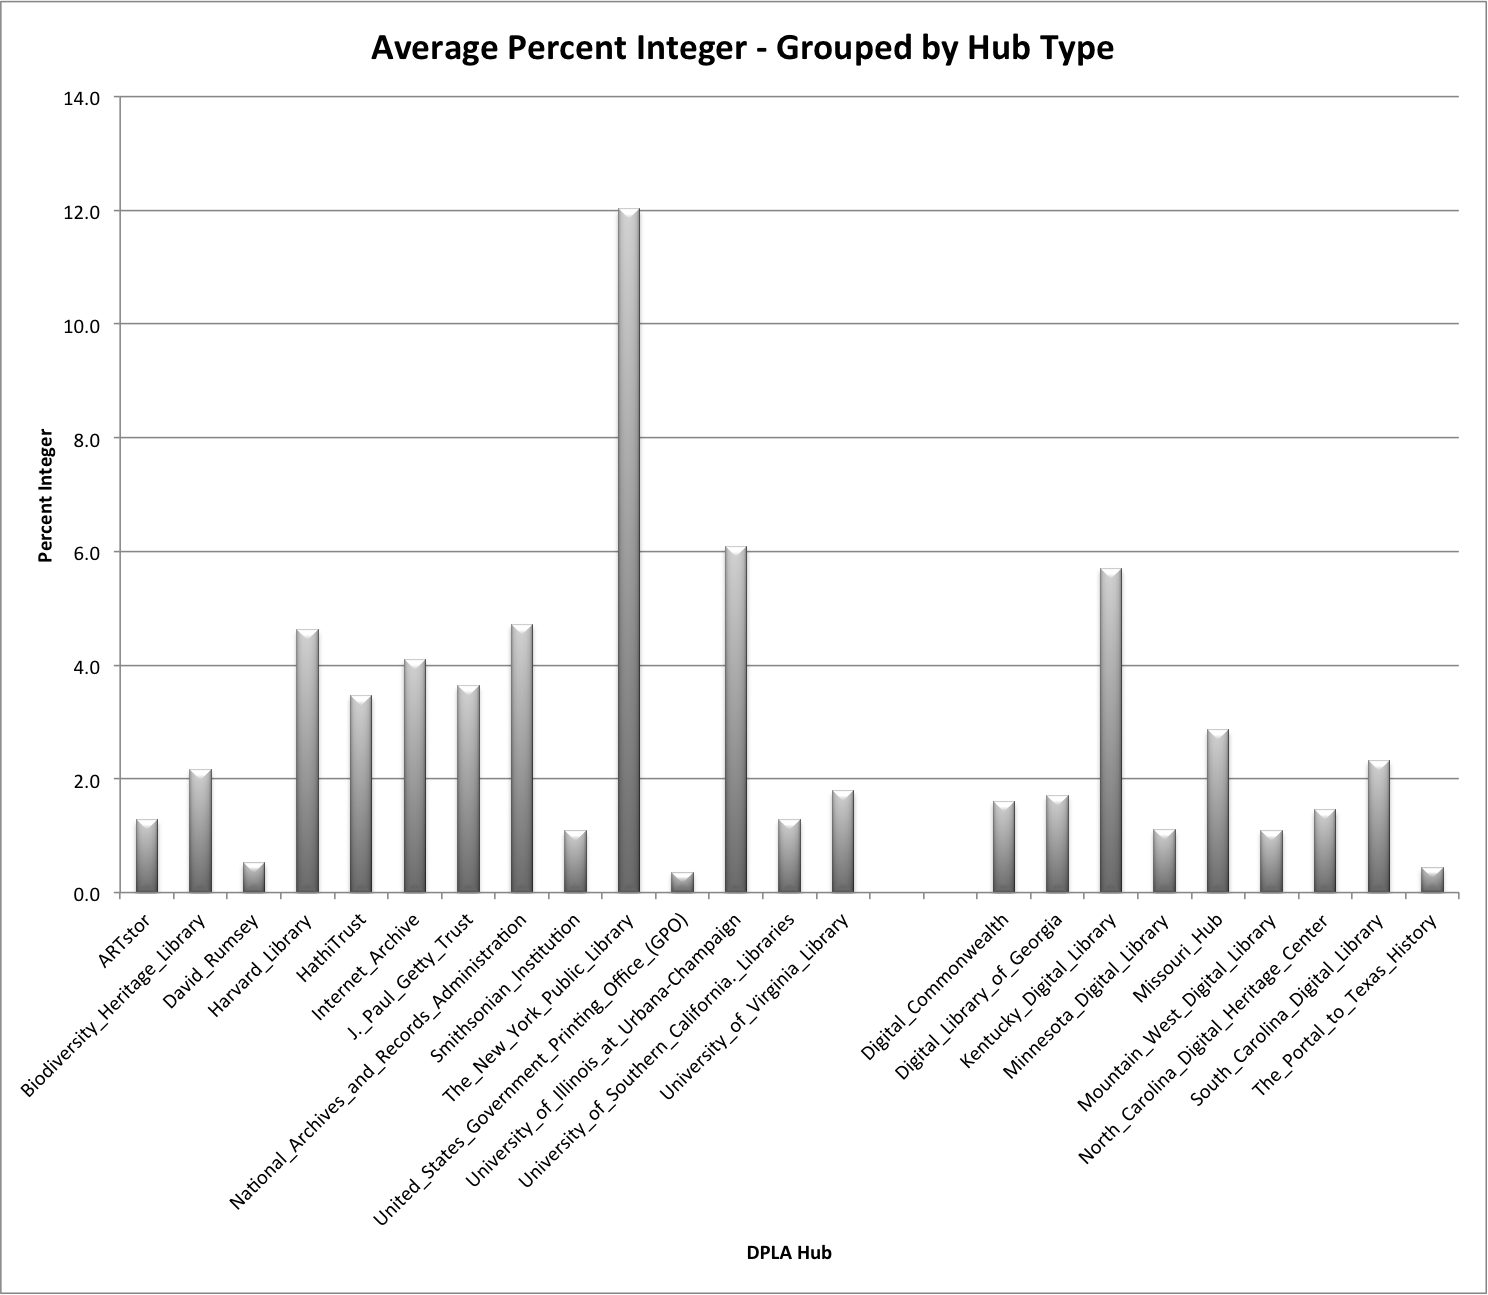
It appears that the Content-Hubs on the left trend a bit higher than the Service-Hubs on the right. This probably has to do with the use of dates in subject strings as a common practice in bibliographic catalog based metadata which isn’t always the same in metadata created for more heterogeneous collections of content that we see in the Service-Hubs.
Tokens
For the tokens metric I replaced punctuation character instance with a single space character and then used the nltk word_tokenize function to return a list of tokens. I then just to the length of that resulting list for the metric.
| Hub | Unique Subjects | Maximum Tokens | Average Tokens | stddev |
| ARTstor | 9,560 | 31 | 2.36 | 2.12 |
| Biodiversity_Heritage_Library | 22,004 | 66 | 2.29 | 1.46 |
| David_Rumsey | 123 | 5 | 1.63 | 0.94 |
| Digital_Commonwealth | 41,704 | 469 | 2.78 | 3.70 |
| Digital_Library_of_Georgia | 132,160 | 23 | 3.70 | 1.72 |
| Harvard_Library | 9,257 | 17 | 4.07 | 1.77 |
| HathiTrust | 685,733 | 107 | 4.75 | 2.31 |
| Internet_Archive | 56,910 | 244 | 5.06 | 6.21 |
| J._Paul_Getty_Trust | 2,777 | 15 | 4.11 | 2.14 |
| Kentucky_Digital_Library | 1,972 | 20 | 4.65 | 2.50 |
| Minnesota_Digital_Library | 24,472 | 25 | 2.66 | 1.54 |
| Missouri_Hub | 6,893 | 68 | 4.30 | 5.41 |
| Mountain_West_Digital_Library | 227,755 | 549 | 3.64 | 3.51 |
| National_Archives_and_Records_Administration | 7,086 | 26 | 3.48 | 2.93 |
| North_Carolina_Digital_Heritage_Center | 99,258 | 493 | 3.75 | 2.64 |
| Smithsonian_Institution | 348,302 | 25 | 3.29 | 1.56 |
| South_Carolina_Digital_Library | 23,842 | 180 | 4.87 | 3.45 |
| The_New_York_Public_Library | 69,210 | 20 | 4.28 | 2.14 |
| The_Portal_to_Texas_History | 104,566 | 23 | 2.69 | 1.36 |
| United_States_Government_Printing_Office_(GPO) | 174,067 | 41 | 5.31 | 2.28 |
| University_of_Illinois_at_Urbana-Champaign | 6,183 | 26 | 3.35 | 2.11 |
| University_of_Southern_California._Libraries | 65,958 | 36 | 2.66 | 1.51 |
| University_of_Virginia_Library | 3,736 | 15 | 4.62 | 2.84 |
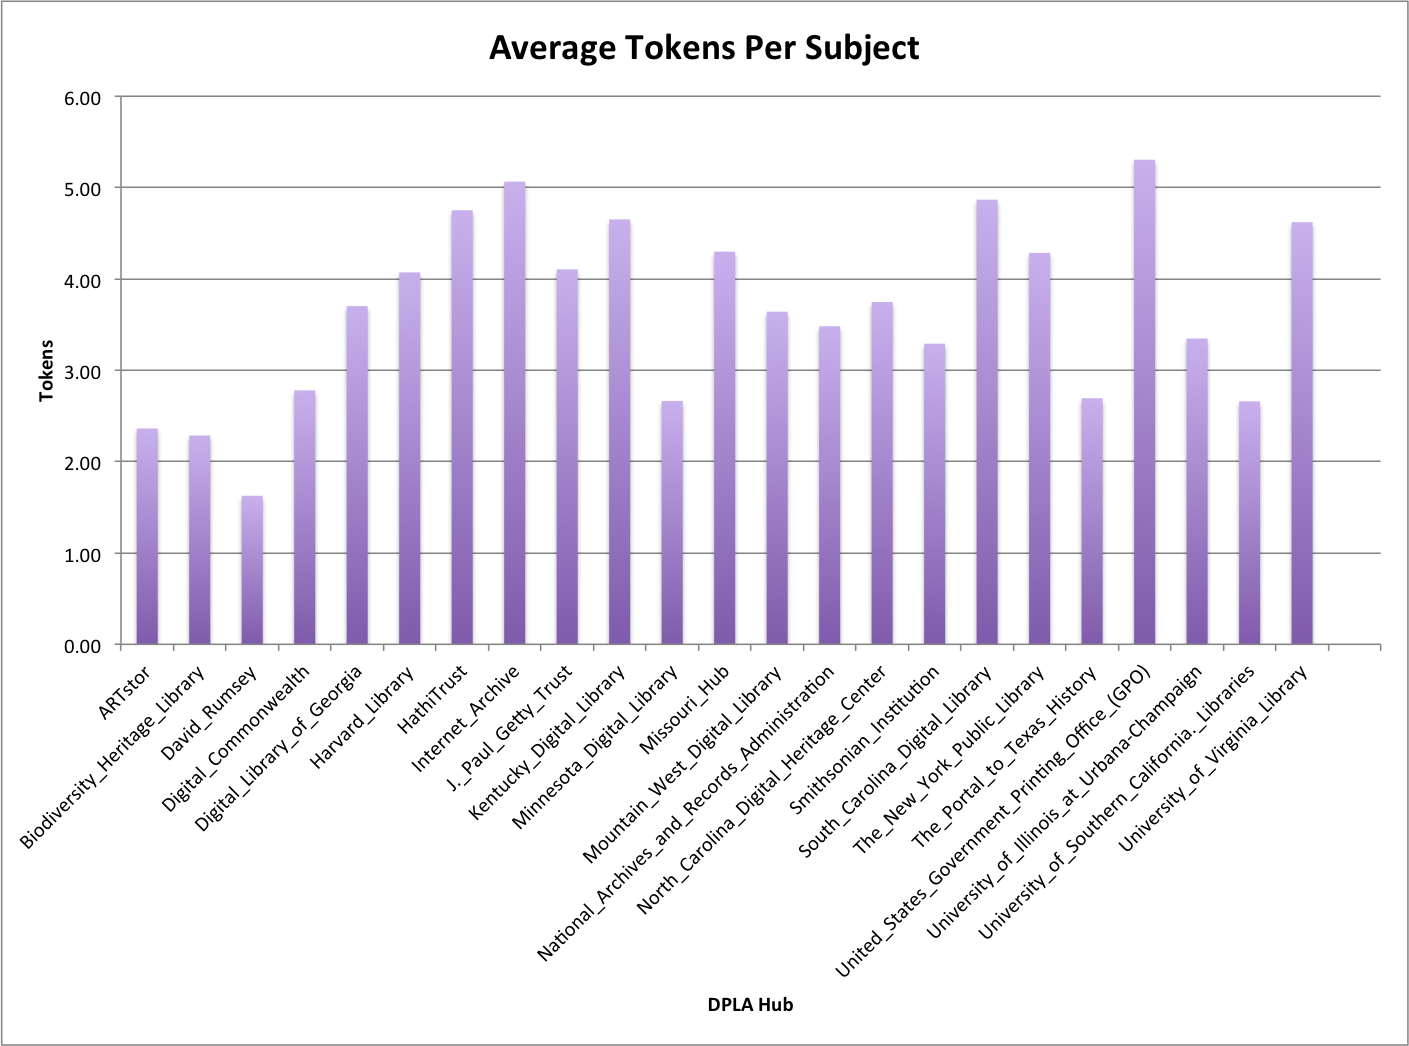
Average number of tokens
Tokens end up being very similar to that of the overall character length of a subject. If I was to do more processing I would probably divide the length by the number of tokens and get an average work length for the tokens in the subjects. That might be interesting.
Anagram
I’ve always found anagrams of values in metadata to be interesting, sometimes helpful and sometimes completely useless. For this value I folded the case of the subject string to convert letters with diacritics to their ASCII version and then created an anagram of the resulting letters. I used the length of this anagram for the metric.
| Hub | Unique Subjects | Min Anagram Length | Median Anagram Length | Max Anagram Length | Avg Anagram Length | stddev |
| ARTstor | 9,560 | 2 | 8 | 23 | 8.93 | 3.63 |
| Biodiversity_Heritage_Library | 22,004 | 0 | 7.5 | 23 | 9.33 | 3.26 |
| David_Rumsey | 123 | 3 | 12 | 13 | 7.93 | 2.28 |
| Digital_Commonwealth | 41,704 | 0 | 9 | 26 | 9.97 | 3.01 |
| Digital_Library_of_Georgia | 132,160 | 0 | 9.5 | 23 | 11.74 | 3.18 |
| Harvard_Library | 9,257 | 3 | 11 | 21 | 12.51 | 2.92 |
| HathiTrust | 685,733 | 0 | 14 | 25 | 13.56 | 2.98 |
| Internet_Archive | 56,910 | 0 | 22 | 26 | 12.41 | 3.96 |
| J._Paul_Getty_Trust | 2,777 | 3 | 19 | 21 | 13.02 | 3.60 |
| Kentucky_Digital_Library | 1,972 | 2 | 14.5 | 22 | 13.02 | 3.28 |
| Minnesota_Digital_Library | 24,472 | 0 | 12 | 22 | 9.76 | 3.00 |
| Missouri_Hub | 6,893 | 0 | 22 | 25 | 11.09 | 4.06 |
| Mountain_West_Digital_Library | 227,755 | 0 | 7 | 26 | 11.85 | 3.54 |
| National_Archives_and_Records_Administration | 7,086 | 3 | 11 | 22 | 10.01 | 3.09 |
| North_Carolina_Digital_Heritage_Center | 99,258 | 0 | 6 | 26 | 11.00 | 3.54 |
| Smithsonian_Institution | 348,302 | 0 | 8 | 23 | 11.53 | 3.42 |
| South_Carolina_Digital_Library | 23,842 | 1 | 12 | 26 | 13.08 | 3.67 |
| The_New_York_Public_Library | 69,210 | 0 | 10 | 24 | 11.45 | 3.17 |
| The_Portal_to_Texas_History | 104,566 | 0 | 10.5 | 23 | 9.78 | 2.98 |
| United_States_Government_Printing_Office_(GPO) | 174,067 | 0 | 14 | 24 | 14.56 | 2.80 |
| University_of_Illinois_at_Urbana-Champaign | 6,183 | 3 | 7 | 21 | 10.42 | 3.46 |
| University_of_Southern_California._Libraries | 65,958 | 0 | 9 | 23 | 9.81 | 3.20 |
| University_of_Virginia_Library | 3,736 | 0 | 9 | 22 | 12.76 | 4.31 |
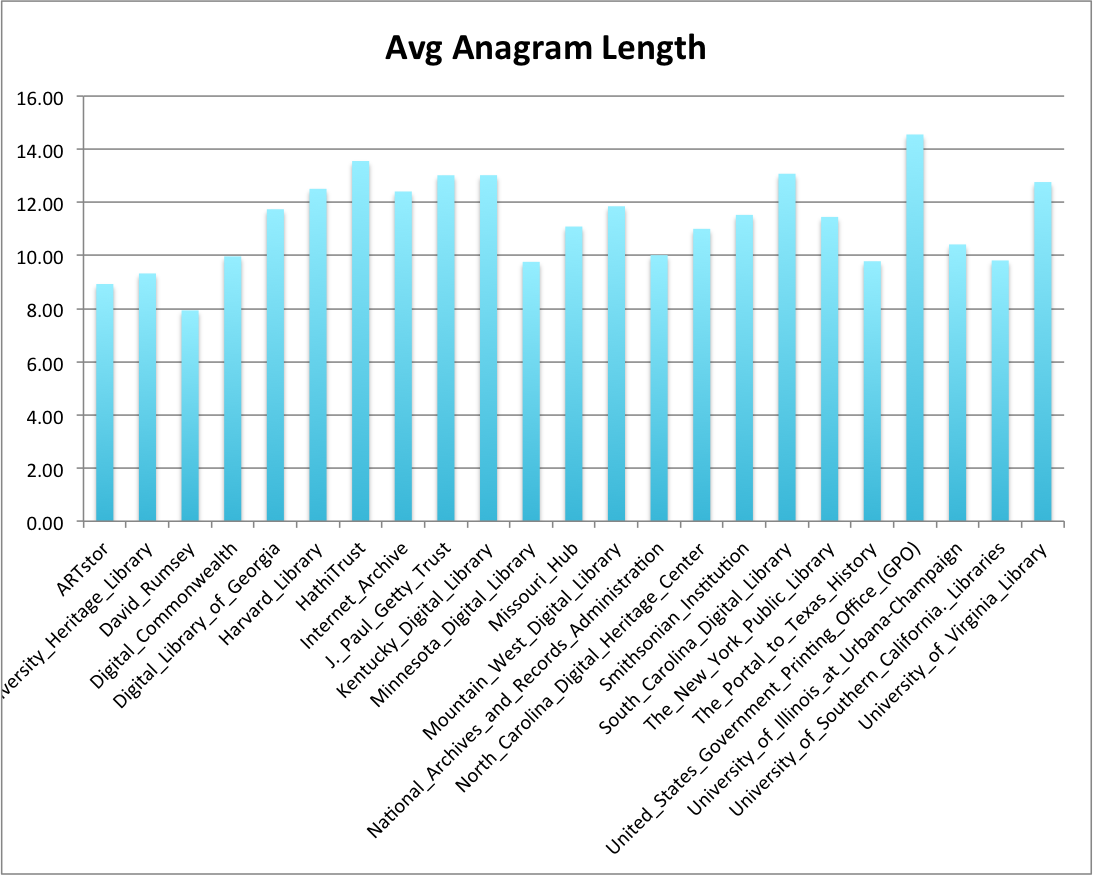
Average anagram length
I find this interesting in that there are subjects in several of the Hubs (Digital_Commonwealth, Internet Archive, Mountain West Digital Library, and South Carolina Digital Library that have a single subject instance that contains all 26 letters. That’s just neat. Now I didn’t look to see if these are the same subject instances that were themselves 3000+ characters long.
| North_Carolina_Digital_Heritage_Center |
Punctuation
It can be interesting to see what punctuation was used in a field so I extracted all non-alphanumeric values from the string which left me with the punctuation characters. I took the number of unique punctuation characters for this metric.
| Hub Name | Unique Subjects | min | median | max | mean | stddev |
| ARTstor | 9,560 | 0 | 0 | 8 | 0.73 | 1.22 |
| Biodiversity Heritage Library | 22,004 | 0 | 0 | 8 | 0.59 | 1.02 |
| David Rumsey | 123 | 0 | 0 | 4 | 0.18 | 0.53 |
| Digital Commonwealth | 41,704 | 0 | 1.5 | 10 | 1.21 | 1.10 |
| Digital Library of Georgia | 132,160 | 0 | 1 | 7 | 1.34 | 0.96 |
| Harvard_Library | 9,257 | 0 | 0 | 6 | 1.65 | 1.02 |
| HathiTrust | 685,733 | 0 | 1 | 9 | 1.63 | 1.16 |
| Internet_Archive | 56,910 | 0 | 2 | 11 | 1.47 | 1.75 |
| J_Paul_Getty_Trust | 2,777 | 0 | 2 | 6 | 1.58 | 0.99 |
| Kentucky_Digital_Library | 1,972 | 0 | 1.5 | 5 | 1.50 | 1.38 |
| Minnesota_Digital_Library | 24,472 | 0 | 0 | 7 | 0.42 | 0.74 |
| Missouri_Hub | 6,893 | 0 | 3 | 7 | 1.24 | 1.37 |
| Mountain_West_Digital_Library | 227,755 | 0 | 1 | 8 | 0.97 | 1.04 |
| National_Archives_and_Records_Administration | 7,086 | 0 | 3 | 7 | 1.68 | 1.61 |
| North_Carolina_Digital_Heritage_Center | 99,258 | 0 | 0.5 | 7 | 1.34 | 0.93 |
| Smithsonian_Institution | 348,302 | 0 | 2 | 7 | 0.84 | 0.96 |
| South_Carolina_Digital_Library | 23,842 | 0 | 3.5 | 8 | 1.68 | 1.41 |
| The_New_York_Public_Library | 69,210 | 0 | 1 | 7 | 1.57 | 1.12 |
| The_Portal_to_Texas_History | 104,566 | 0 | 1 | 7 | 0.84 | 0.91 |
| United_States_Government_Printing_Office_(GPO) | 174,067 | 0 | 2 | 7 | 1.38 | 0.99 |
| University_of_Illinois_at_Urbana-Champaign | 6,183 | 0 | 2 | 6 | 1.31 | 1.25 |
| University_of_Southern_California_Libraries | 65,958 | 0 | 0 | 7 | 0.75 | 1.09 |
| University_of_Virginia_Library | 3,736 | 0 | 5 | 7 | 1.67 | 1.58 |
| 63 | 0 | 2 | 5 | 1.17 | 1.31 |
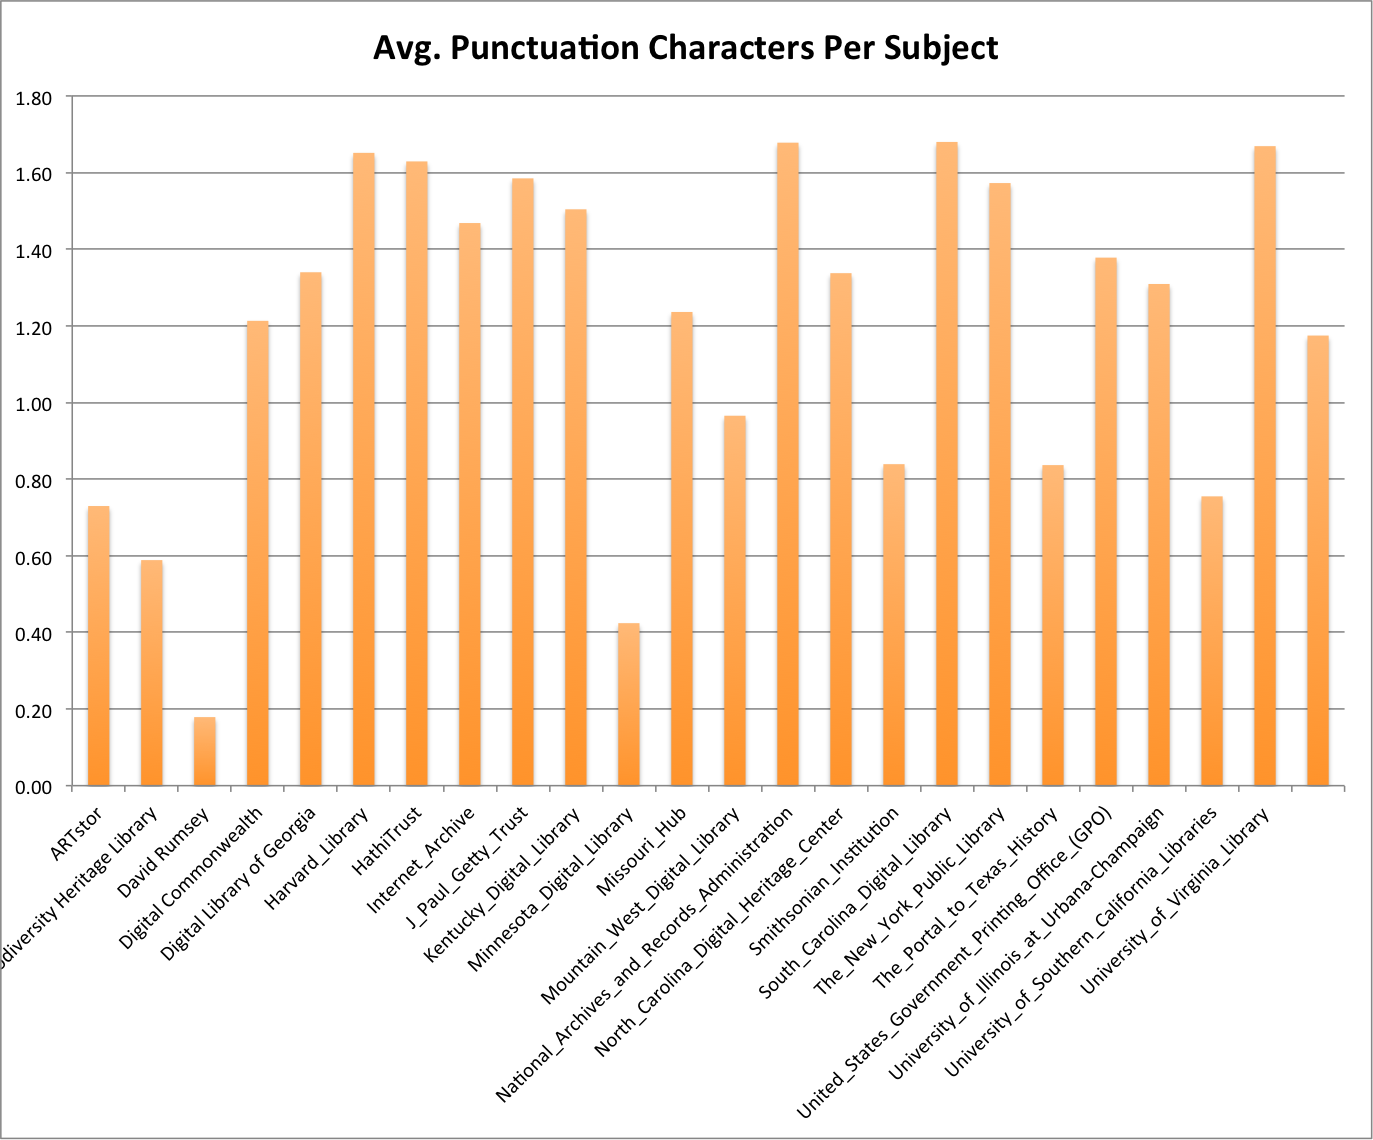
Average Punctuation Characters
Again on this one I don’t have much to talk about. I do know that I plan to take a look at what punctuation characters are being used by which hubs. I have a feeling that this could be very useful in identifying problems with mapping from one metadata world to another. For example I know there are examples of character patterns that resemble sub-field indicators from a MARC record in the subject values in the DPLA, dataset, (‡, |, and — ) how many that’s something to look at.
Let me know if there are other pieces that you think might be interesting to look at related to this subject work with the DPLA metadata dataset and I’ll see what I can do.
Let me know what you think via Twitter if you have questions or comments.