In the past few posts we looked at the length of the description fields in the DPLA dataset as a whole and at the provider/hub level.
The length of the description field isn’t the only field that was indexed for this work. In fact I indexed on a variety of different values for each of the descriptions in the dataset.
Below are the fields I currently am working with.
| Field | Indexed Value Example |
| dpla_id | 11fb82a0f458b69cf2e7658d8269f179 |
| id | 11fb82a0f458b69cf2e7658d8269f179_01 |
| provider_s | usc |
| desc_order_i | 1 |
| description_t | A corner view of the Santa Monica City Hall.; Streetscape. Horizontal photography. |
| desc_length_i | 82 |
| tokens_ss | “A”, “corner”, “view”, “of”, “the”, “Santa”, “Monica”, “City”, “Hall”, “Streetscape”, “Horizontal”, “photography” |
| token_count_i | 12 |
| average_token_length_f | 5.5833335 |
| percent_int_f | 0 |
| percent_punct_f | 0.048780486 |
| percent_letters_f | 0.81707317 |
| percent_printable_f | 1 |
| percent_special_char_f | 0 |
| token_capitalized_f | 0.5833333 |
| token_lowercased_f | 0.41666666 |
| percent_1000_f | 0.5 |
| non_1000_words_ss | “santa”, “monica”, “hall”, “streetscape”, “horizontal”, “photography” |
| percent_5000_f | 0.6666667 |
| non_5000_words_ss | “santa”, “monica”, “streetscape”, “horizontal” |
| percent_en_dict_f | 0.8333333 |
| non_english_words_ss | “monica”, “streetscape” |
| percent_stopwords_f | 0.25 |
| has_url_b | FALSE |
This post will try and pull together some of the data from the different fields listed above and present them in a way that we will hopefully be able to use to derive some meaning from.
More Description Length Discussion
In the previous posts I’ve primarily focused on the length of the description fields. There are two other fields that I’ve indexed that are related to the length of the description fields. These two fields include the number of tokens in a description and the average token length of fields.
I’ve included those values below. I’ve included two mean values, one for all of the descriptions in the dataset (17,884,946 descriptions) and in the other the descriptions that are 1 character in length or more (13,771,105descriptions).
| Field | Mean – Total | Mean – 1+ length |
| desc_length_i | 83.321 | 108.211 |
| token_count_i | 13.346 | 17.333 |
| average_token_length_f | 3.866 | 5.020 |
The graphs below are based on the numbers of just descriptions that are 1+ length or more.
This first graph is being reused from a previous post that shows the average length of description by Provider/Hub. David Rumsey and the Getty are the two that average over 250 characters per description.
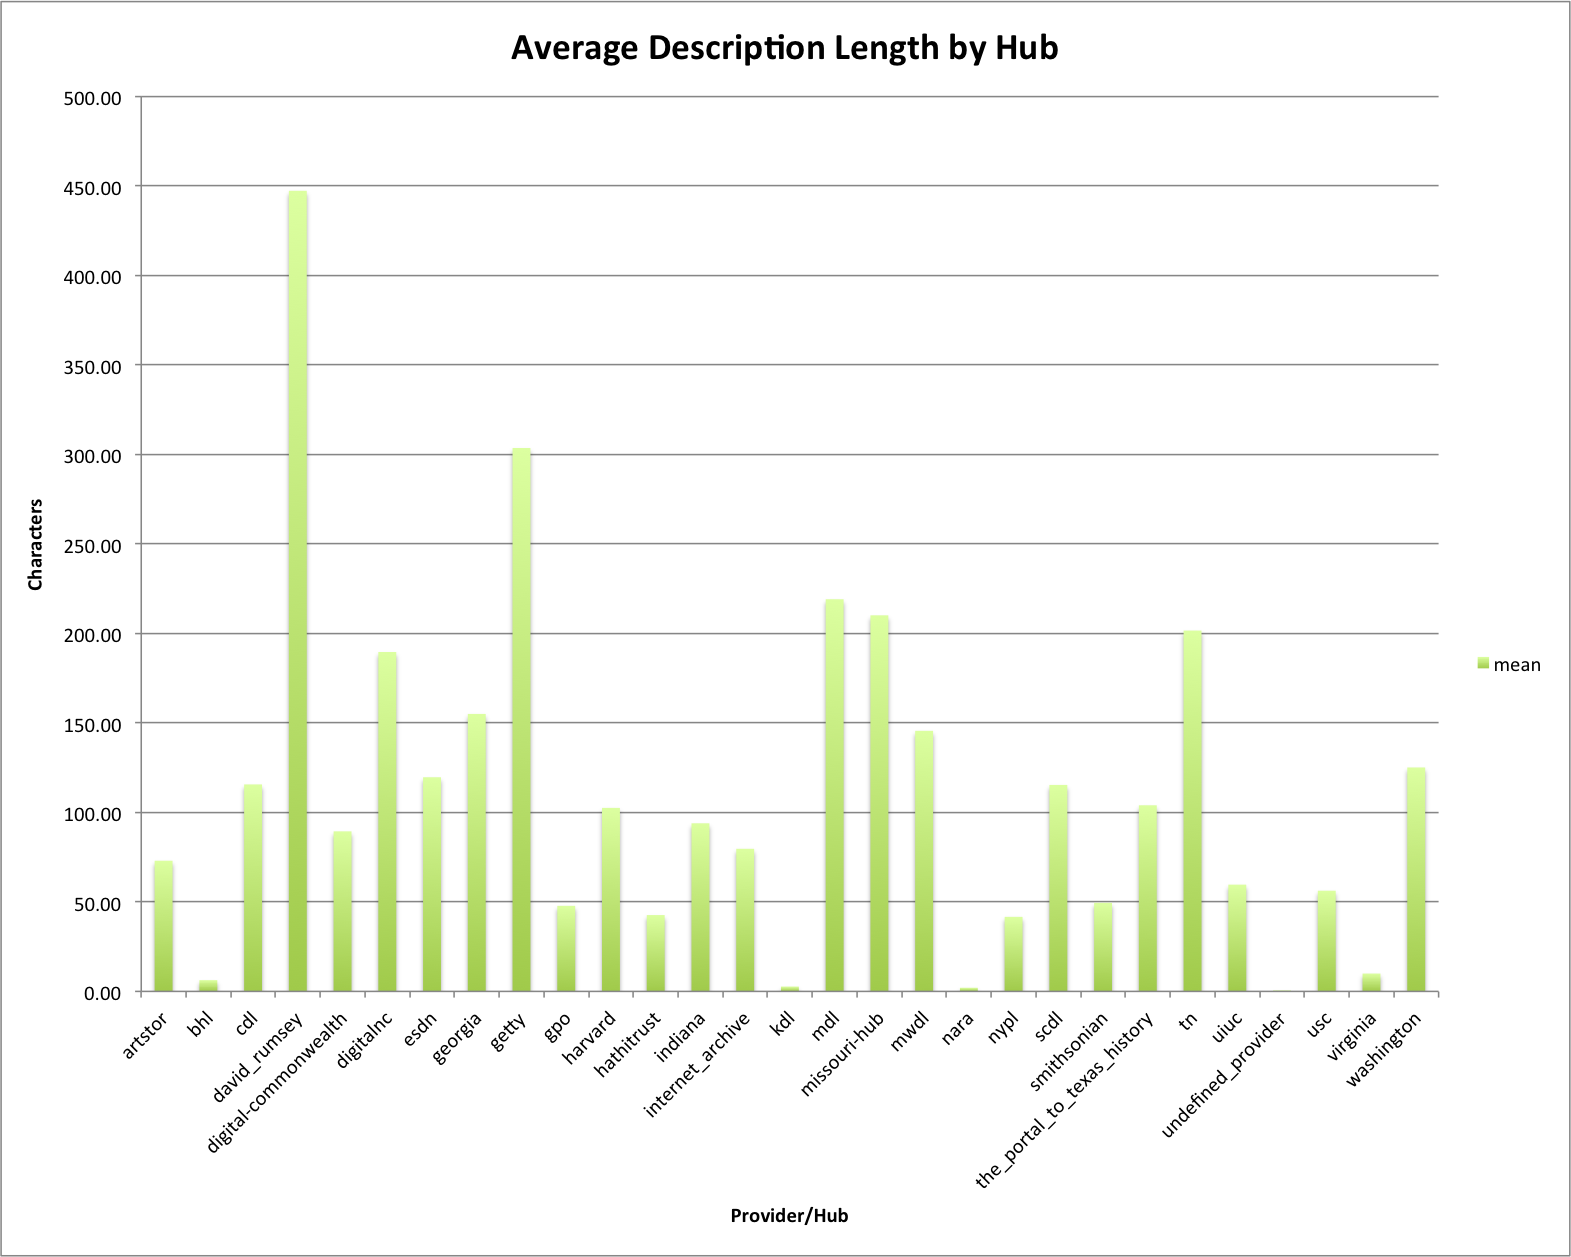
Average Description Length by Hub
It shouldn’t surprise you that David Ramsey and Getter are two of the Providers/Hubs that have the highest average token counts, with longer descriptions generally creating more tokens. There are a few differences that don’t match this though, USC that has an average of just over 50 characters for the average description length comes in as the third highest in the average token counts at over 40 tokens per description. There are a few other providers/hubs that look a bit different than their average description length.
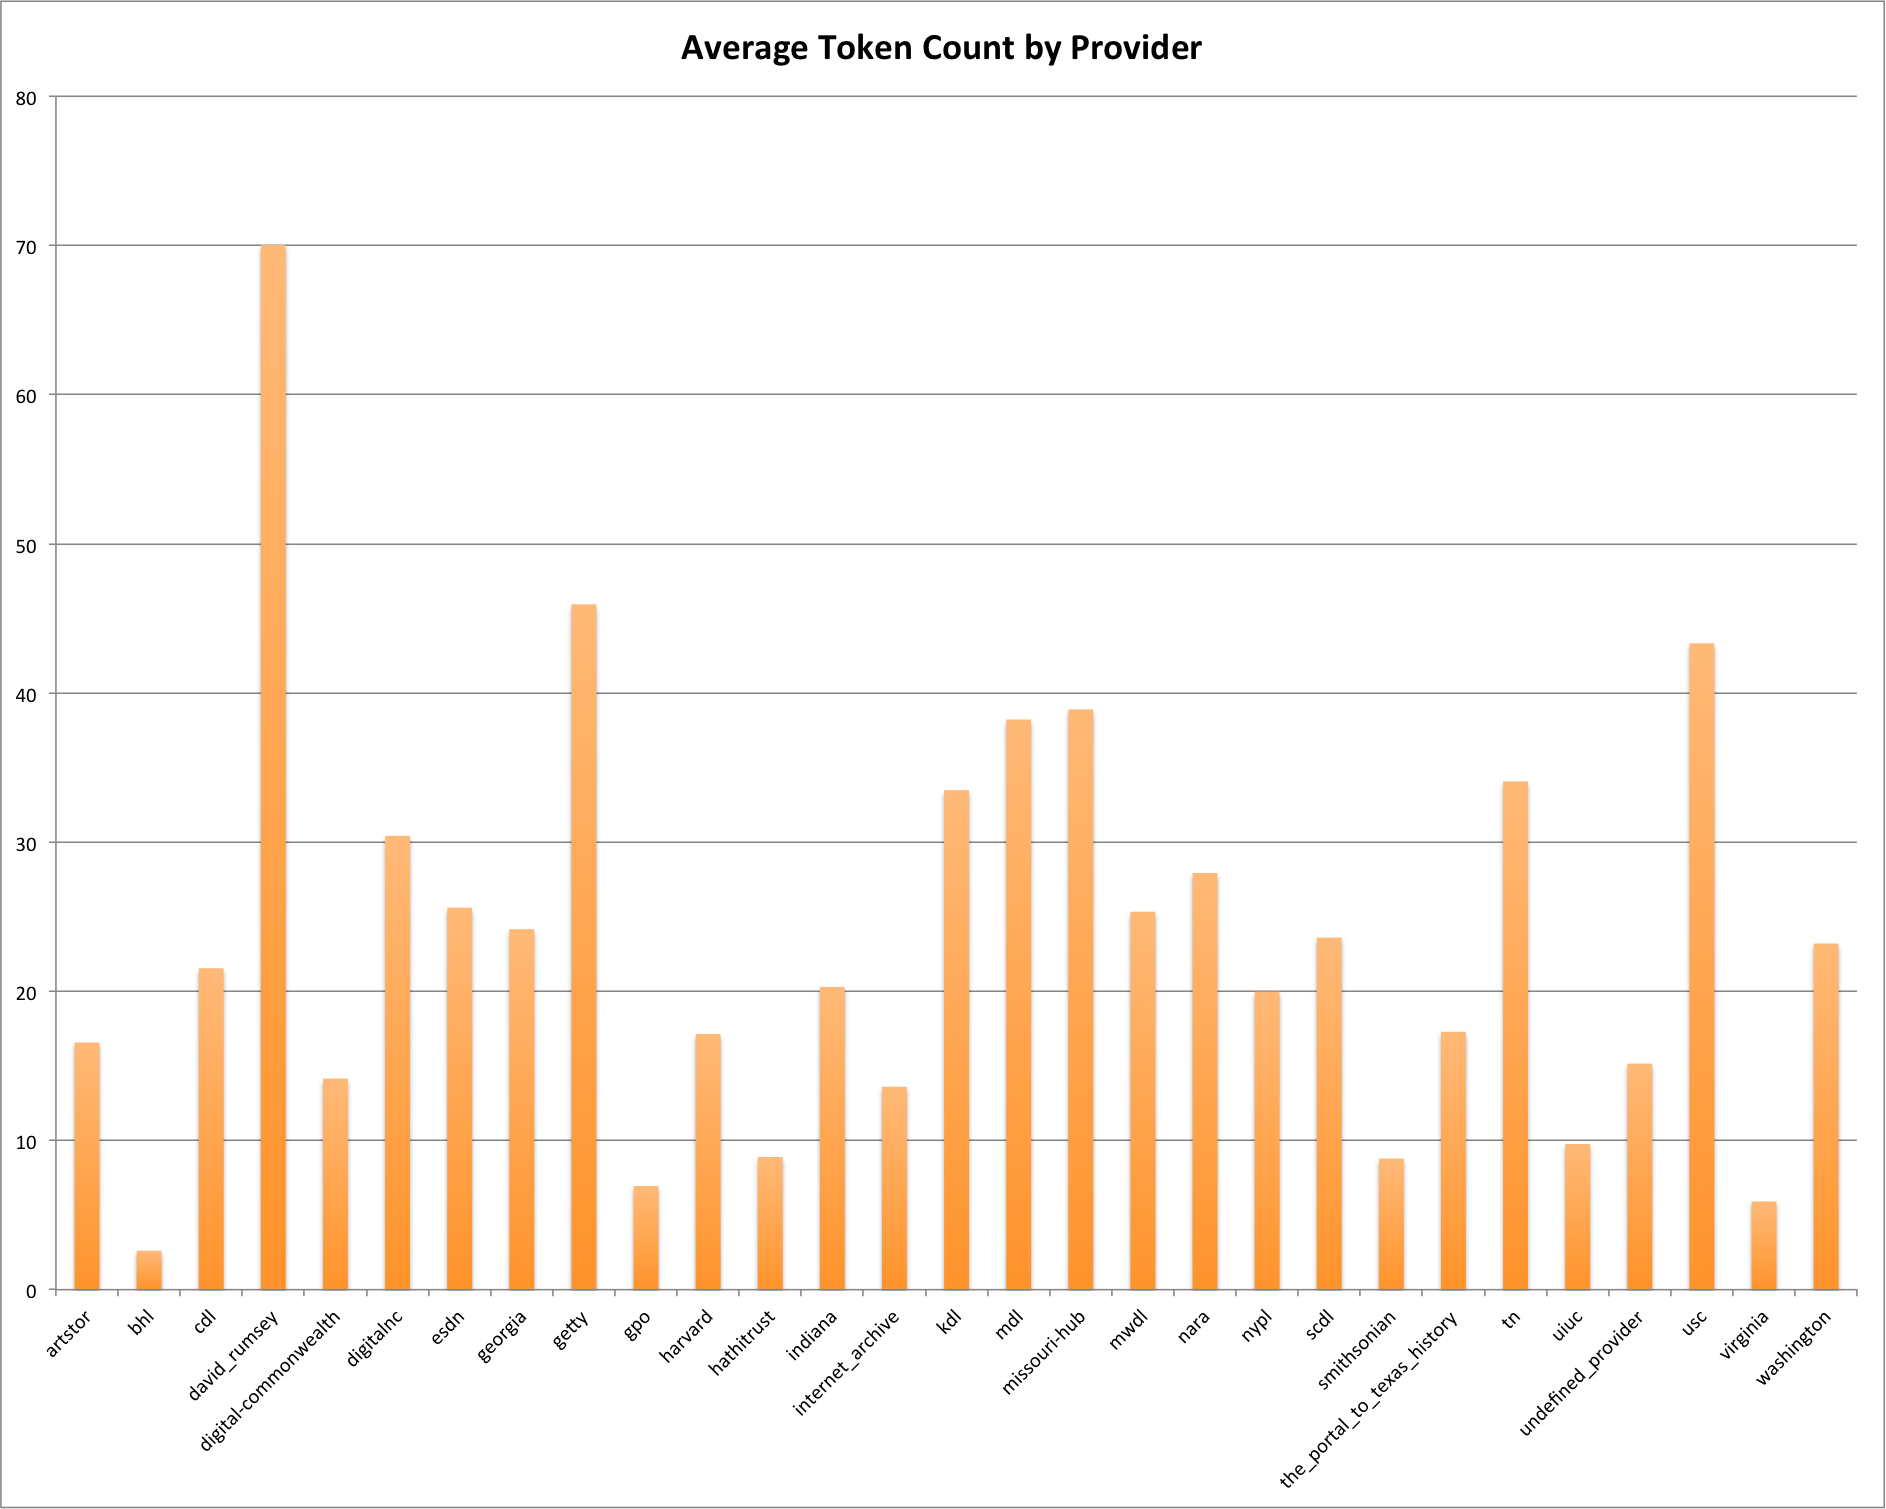
Average Token Count by Provider
Below is a graph of the average token lengths by providers. The lower the number is the lower average length of a token. The mean for the entire DPLA dataset for descriptions of length 1+ is just over 5 characters.
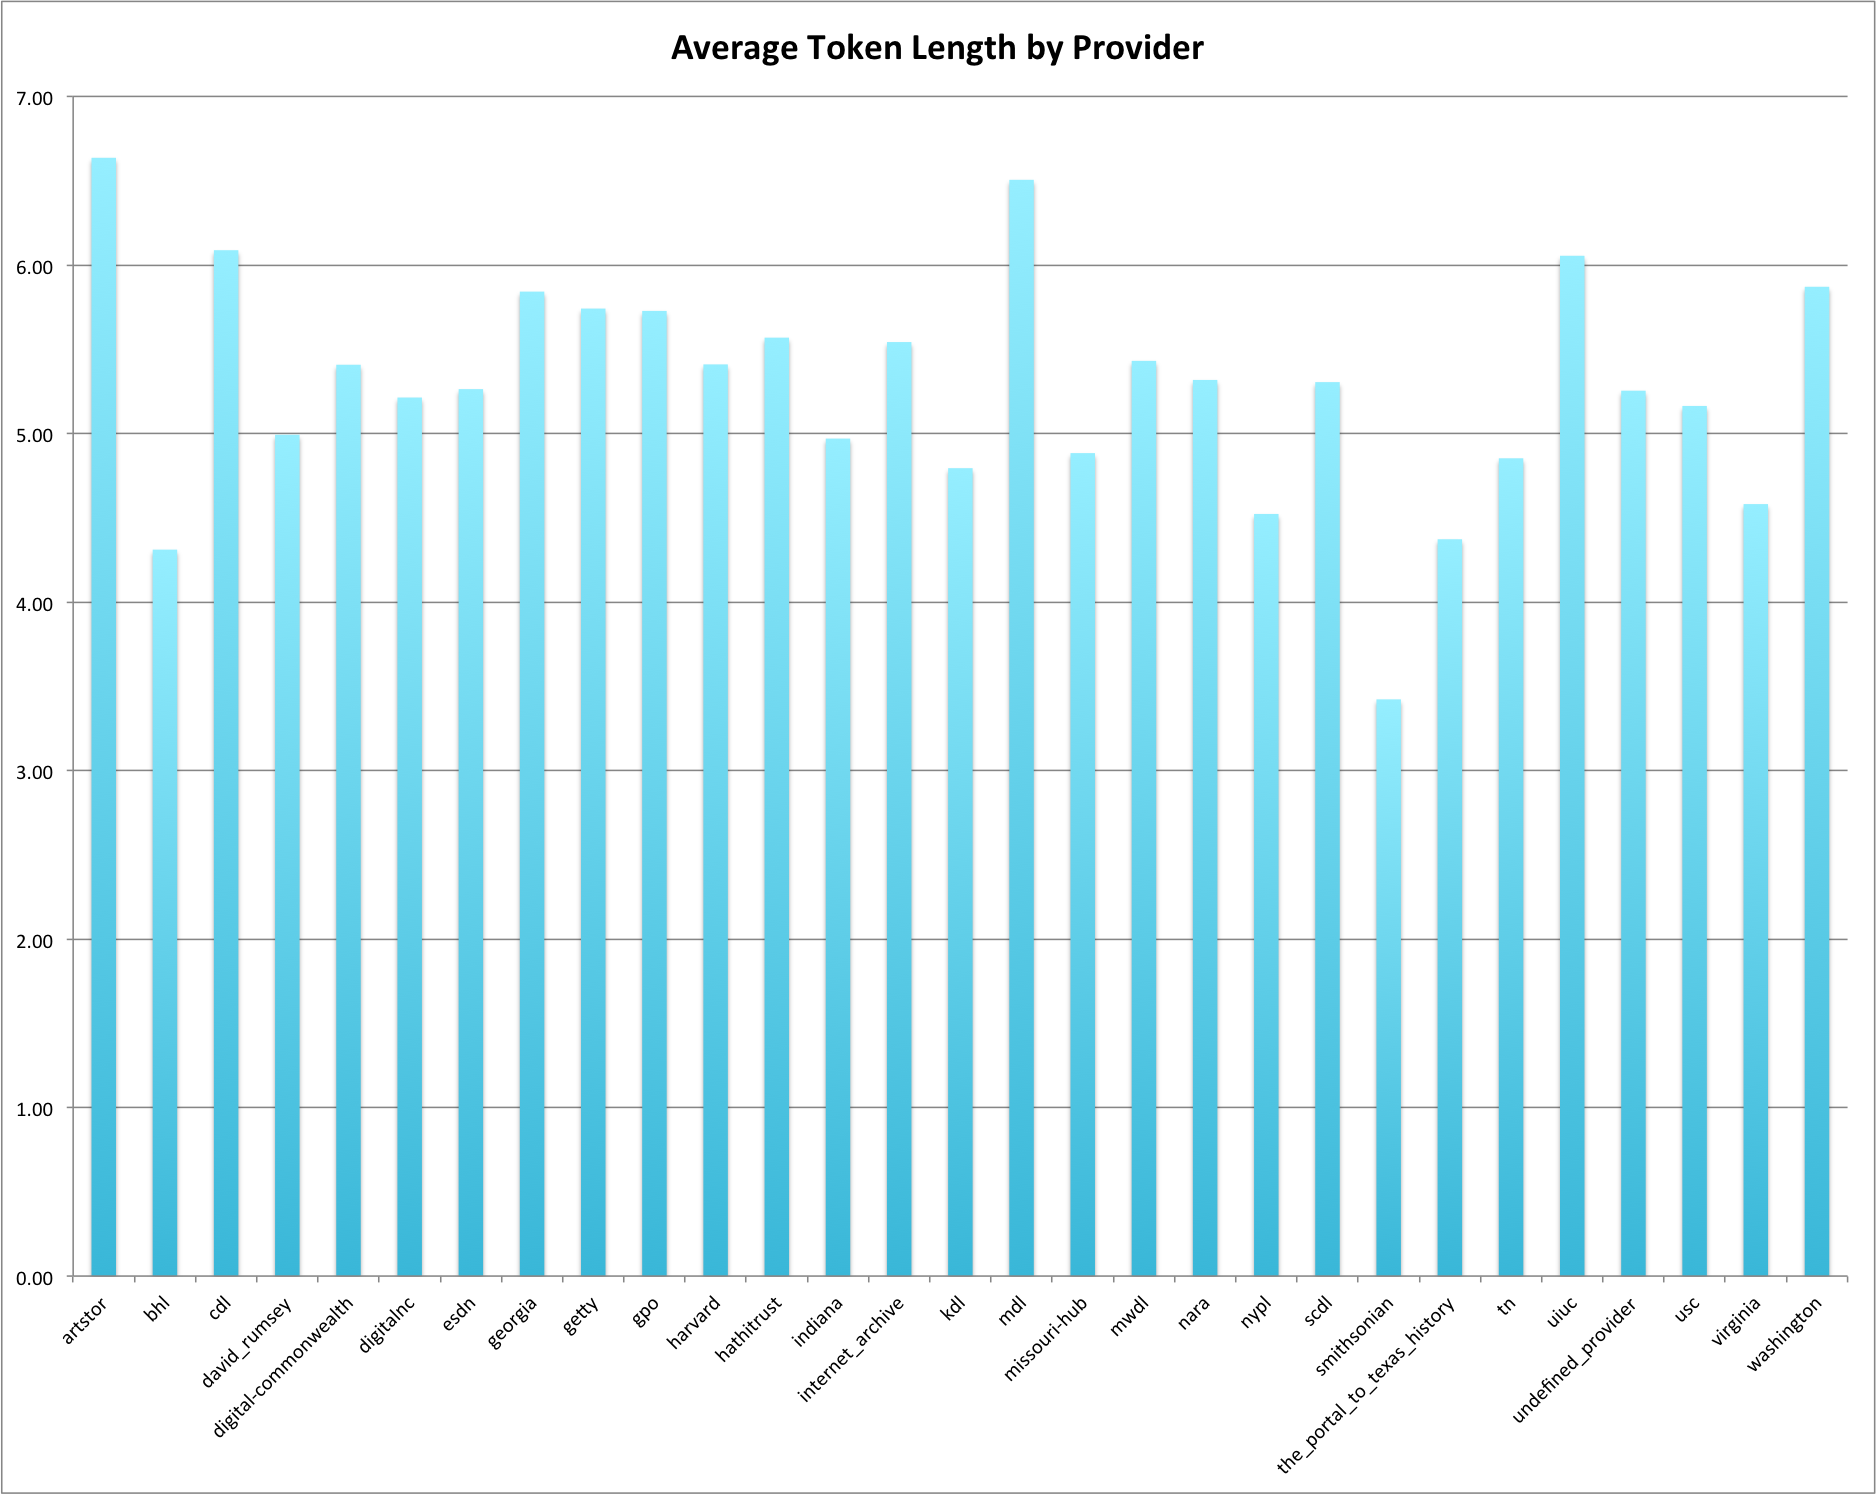
Average Token Length by Provider
That’s all I have to say about the various statistics related to length for this post. I swear!. Next we move on to some of the other metrics that I calculated when indexing things.
Other Metrics for the Description Field
Throughout this analysis I had a question of when to take into account that there were millions of records in the dataset that had no description present. I couldn’t just throw away that fact in the analysis but I didn’t know exactly what to do with them. So below I present statistics for the average of many of the fields I indexed as both the mean of all of the descriptions and then the mean of just the descriptions that are one or more characters in length. The graphs that follow the table below are all based on the subset of descriptions that are greater than or equal to one character in length.
| Field | Mean – Total | Mean – 1+ length |
| percent_int_f | 12.368% | 16.063% |
| percent_punct_f | 4.420% | 5.741% |
| percent_letters_f | 50.730% | 65.885% |
| percent_printable_f | 76.869% | 99.832% |
| percent_special_char_f | 0.129% | 0.168% |
| token_capitalized_f | 26.603% | 34.550% |
| token_lowercased_f | 32.112% | 41.705% |
| percent_1000_f | 19.516% | 25.345% |
| percent_5000_f | 31.591% | 41.028% |
| percent_en_dict_f | 49.539% | 64.338% |
| percent_stopwords_f | 12.749% | 16.557% |
Stopwords
Stopwords are words that occur very commonly in natural language. I used a list of 127 stopwords for this work to help understand what percentage of a description (based on tokens) is made up of stopwords. While stopwords generally carry little meaning for natural language, they are a good indicator of natural language, so providers/hubs that have a higher percentage of stopwords would probably have more descriptions that resemble natural language.
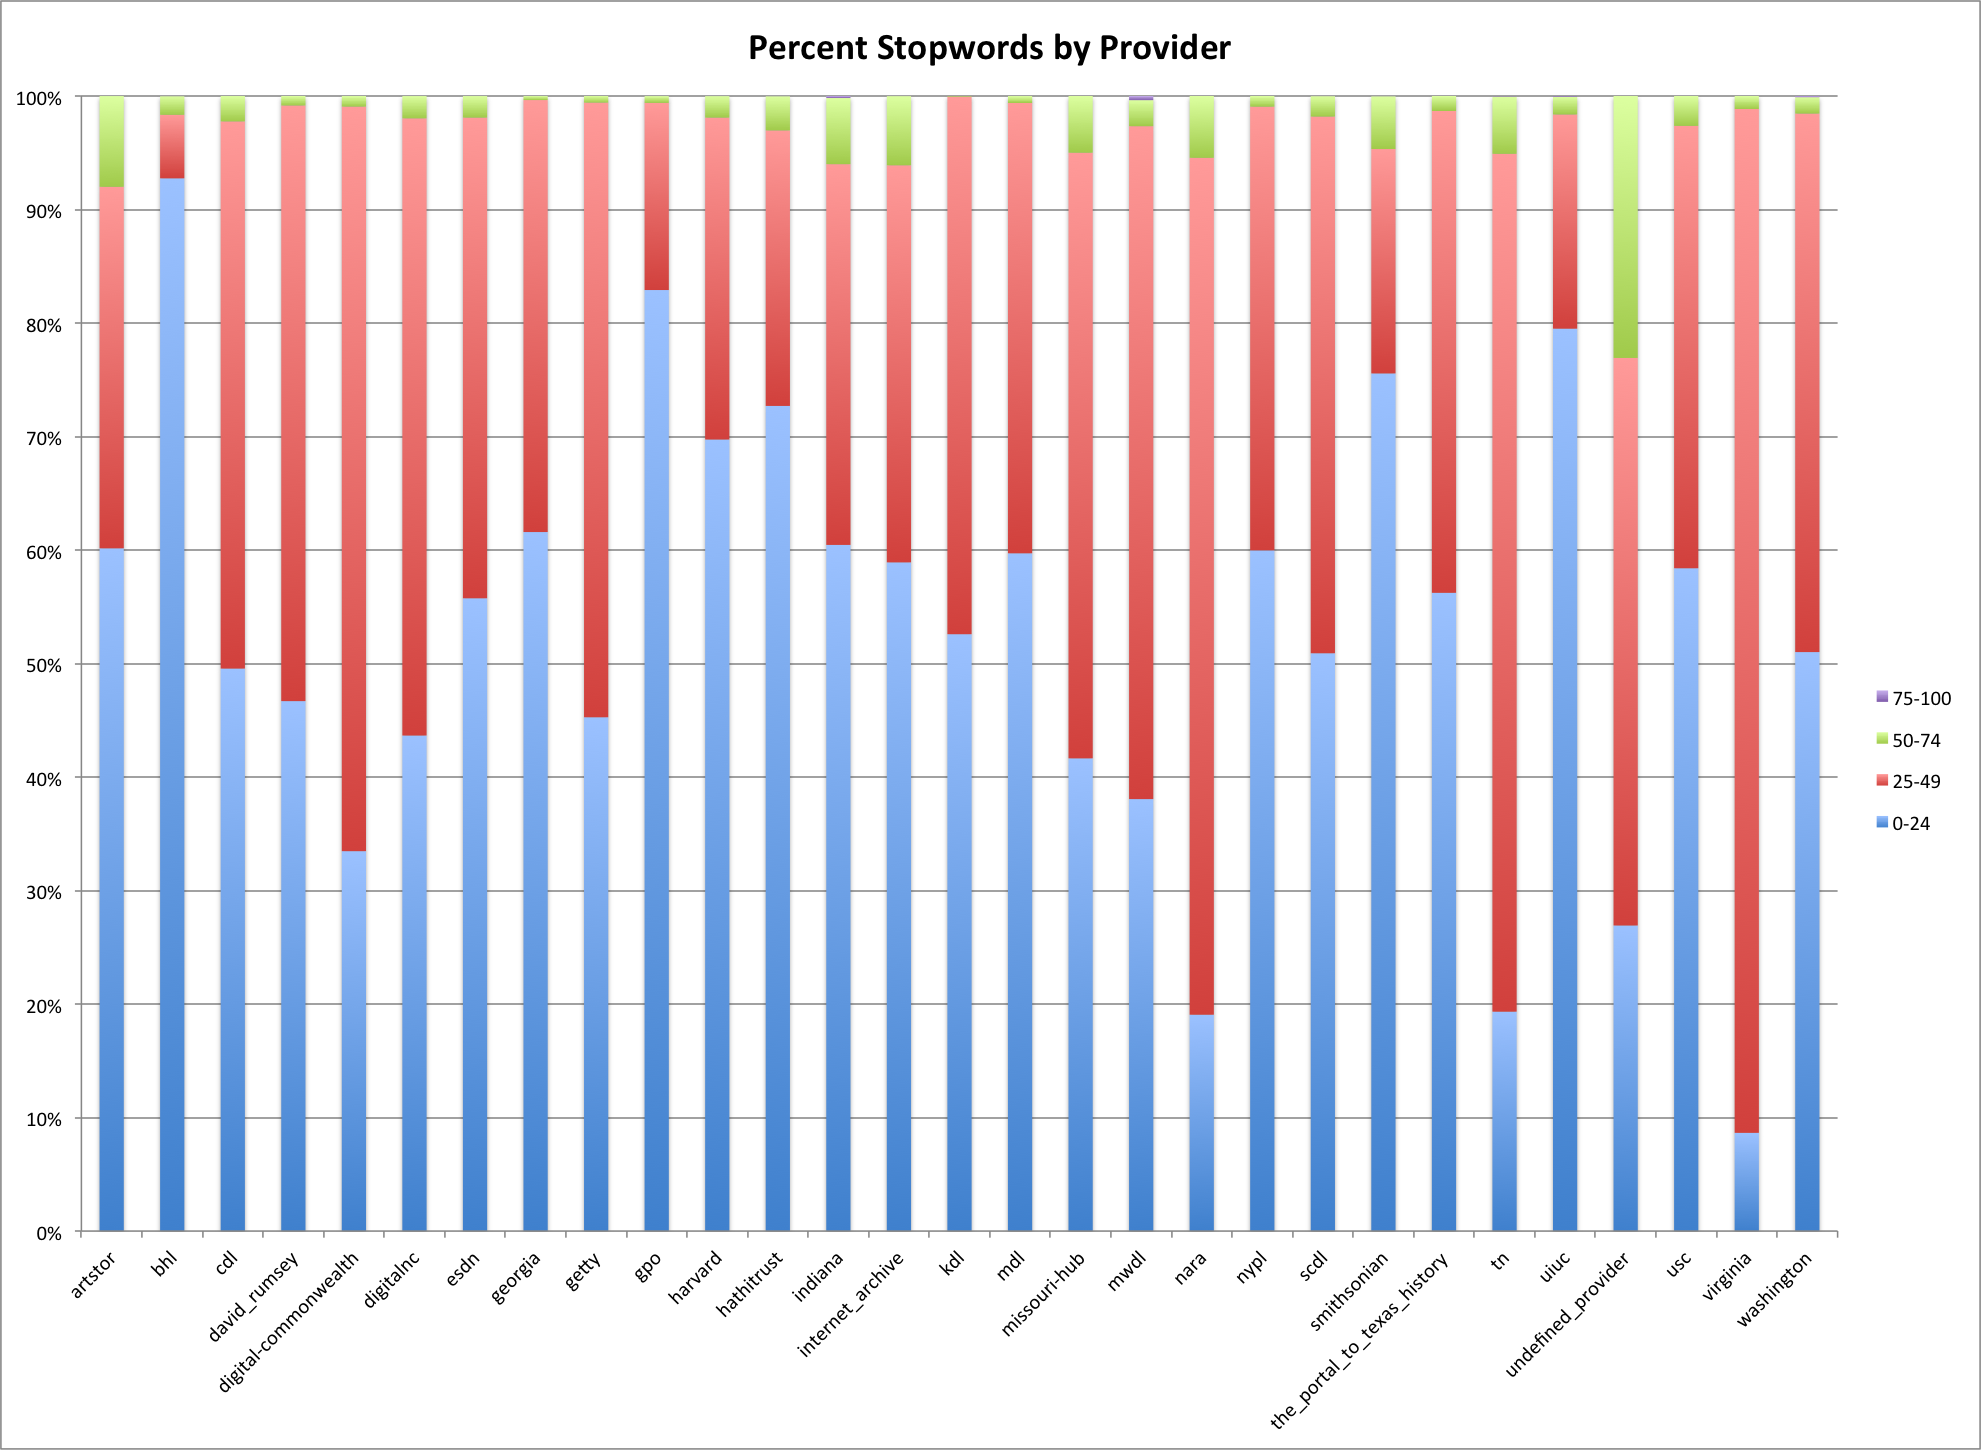
Percent Stopwords by Provider
Punctuation
I was curious about how much punctuation was present in a description on average. I used the following characters as my set of “punctuation characters”
!"#$%&'()*+,-./:;<=>?@[\]^_`{|}~
I found the number of characters in a description that were made up of these characters vs other characters and then divided the number of punctuation characters by the total description length to get the percentage of the description that is punctuation.
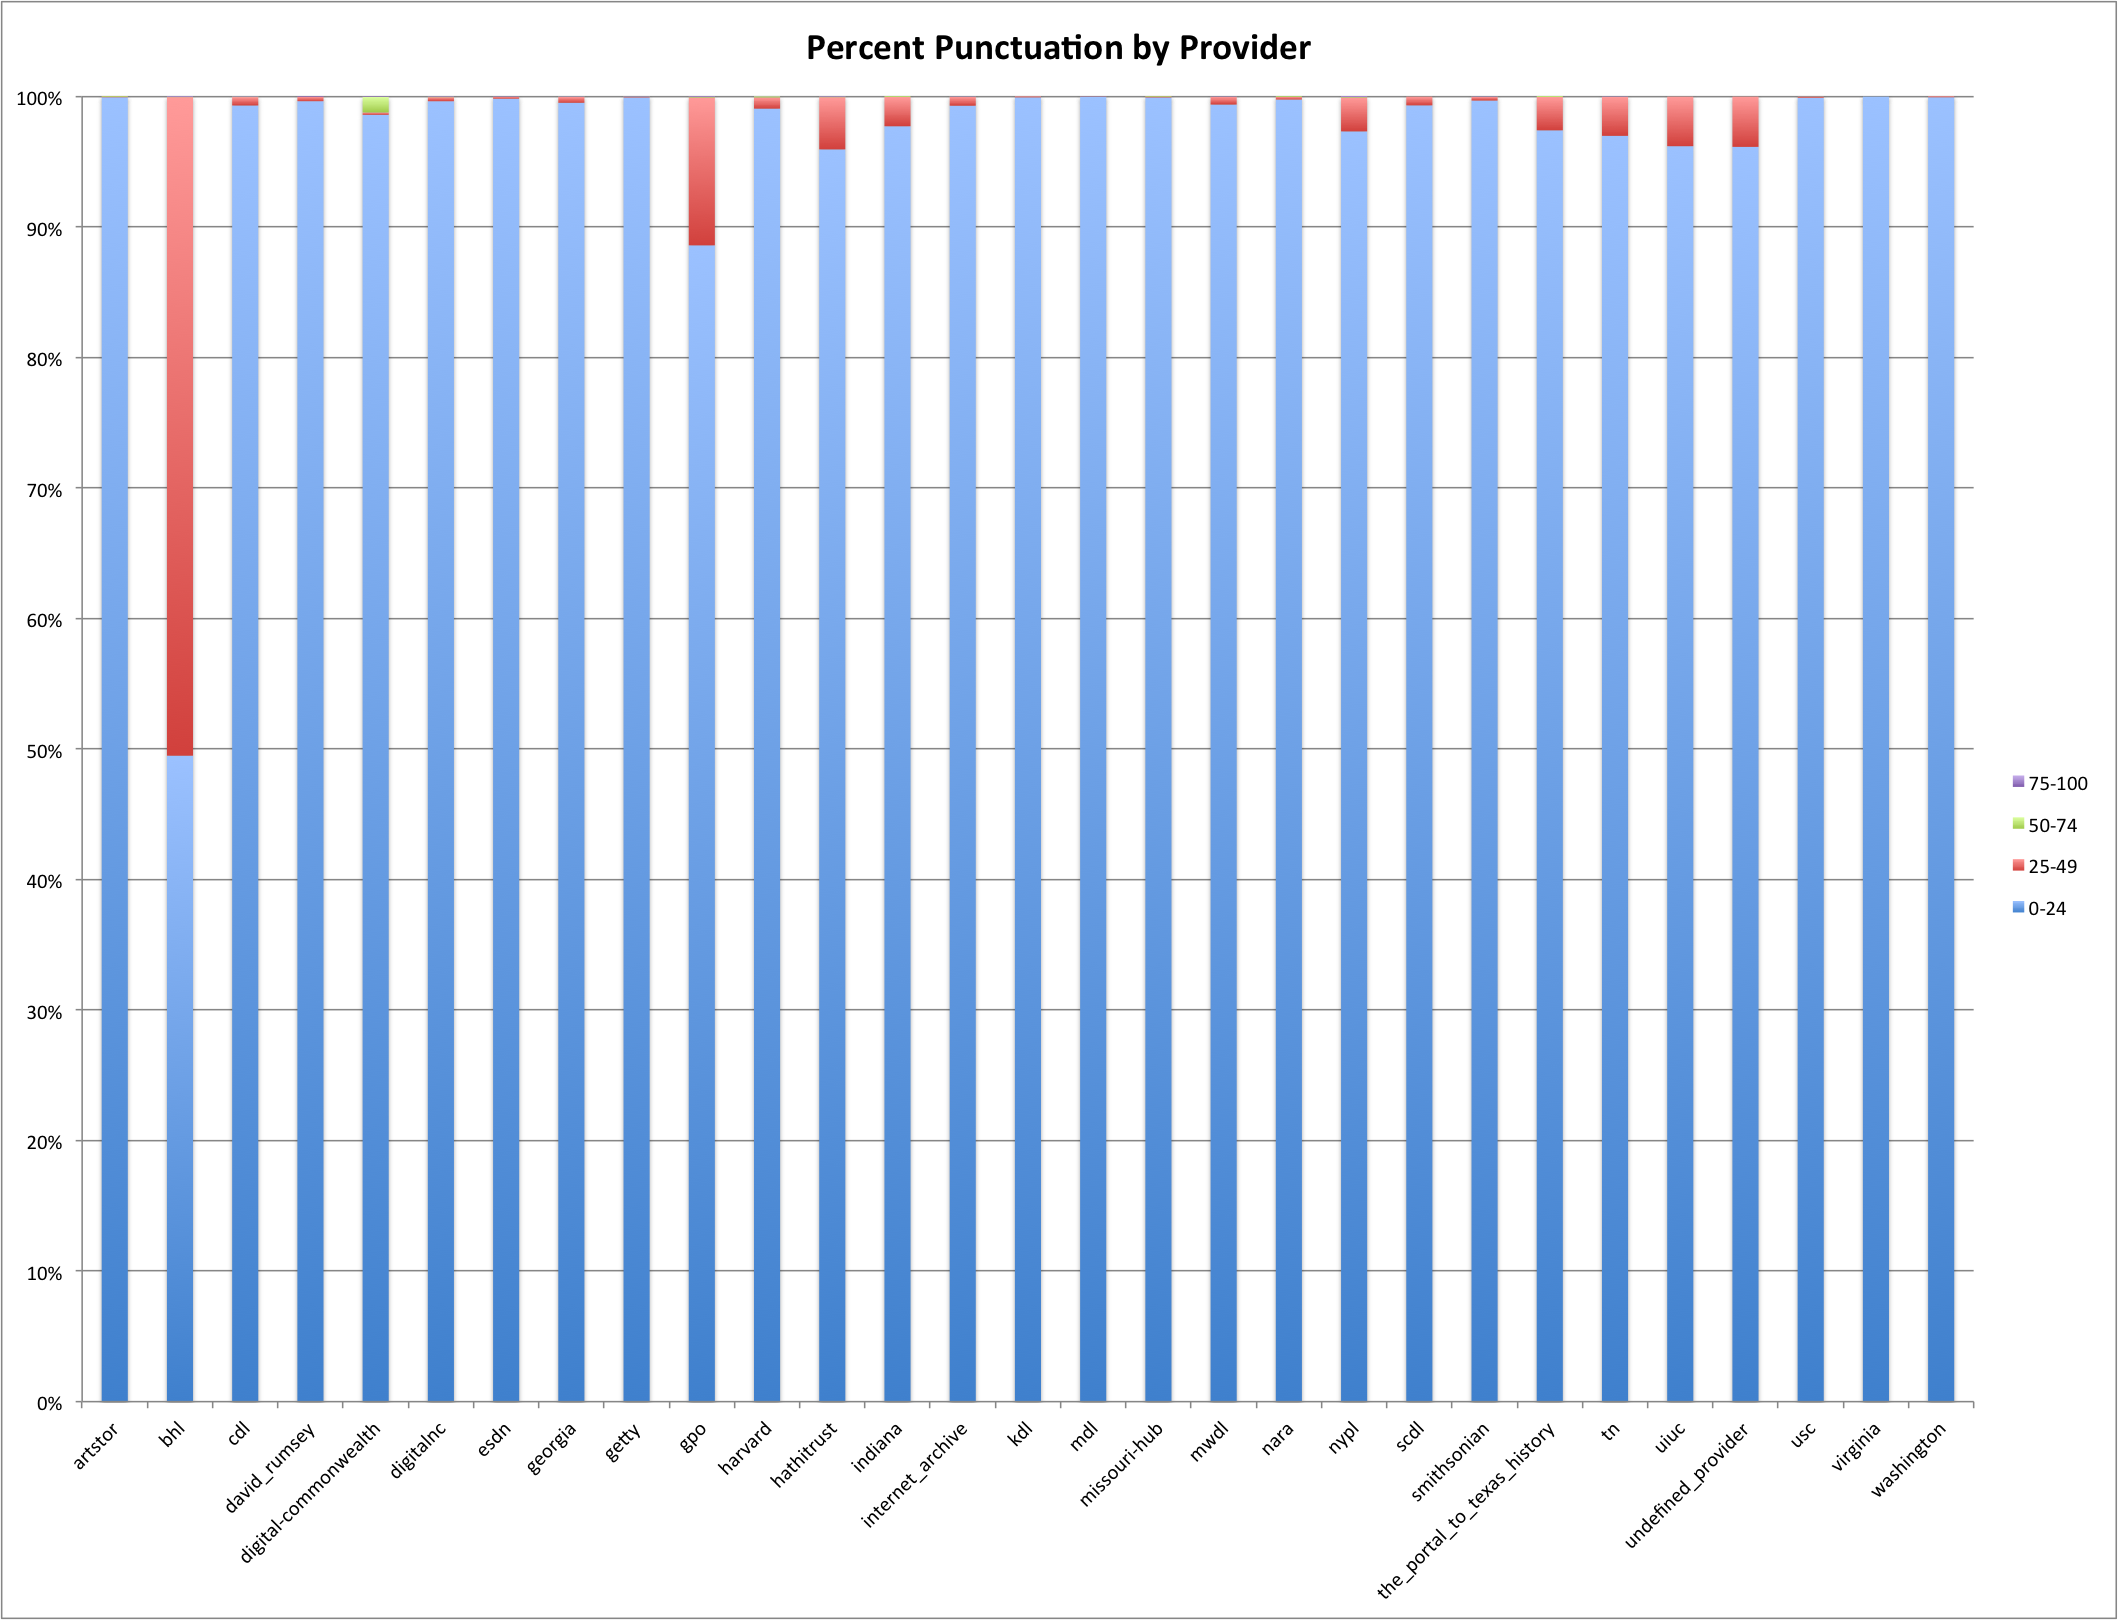
Percent Punctuation by Provider
Punctuation is common in natural language but it occurs relatively infrequently. For example that last sentence was eighty characters long and only one of them was punctuation (the period at the end of the sentence). That comes to a percent_punctuation of only 1.25%. In the graph above you will see the the bhl provider/hub has over 50% of their description with 25-49% punctuation. That’s very high when compared to the other hubs and the fact that there is an average of about 5% overall for the DPLA dataset. Digital Commonwealth has a percentage of descriptions that are from 50-74% punctuation which is pretty interesting as well.
Integers
Next up in our list of things to look at is the percentage of the description field that consists of integers. For review, integers are digits, like the following.
0123456789
I used the same process for the percent integer as I did for the percent punctuation mentioned above.
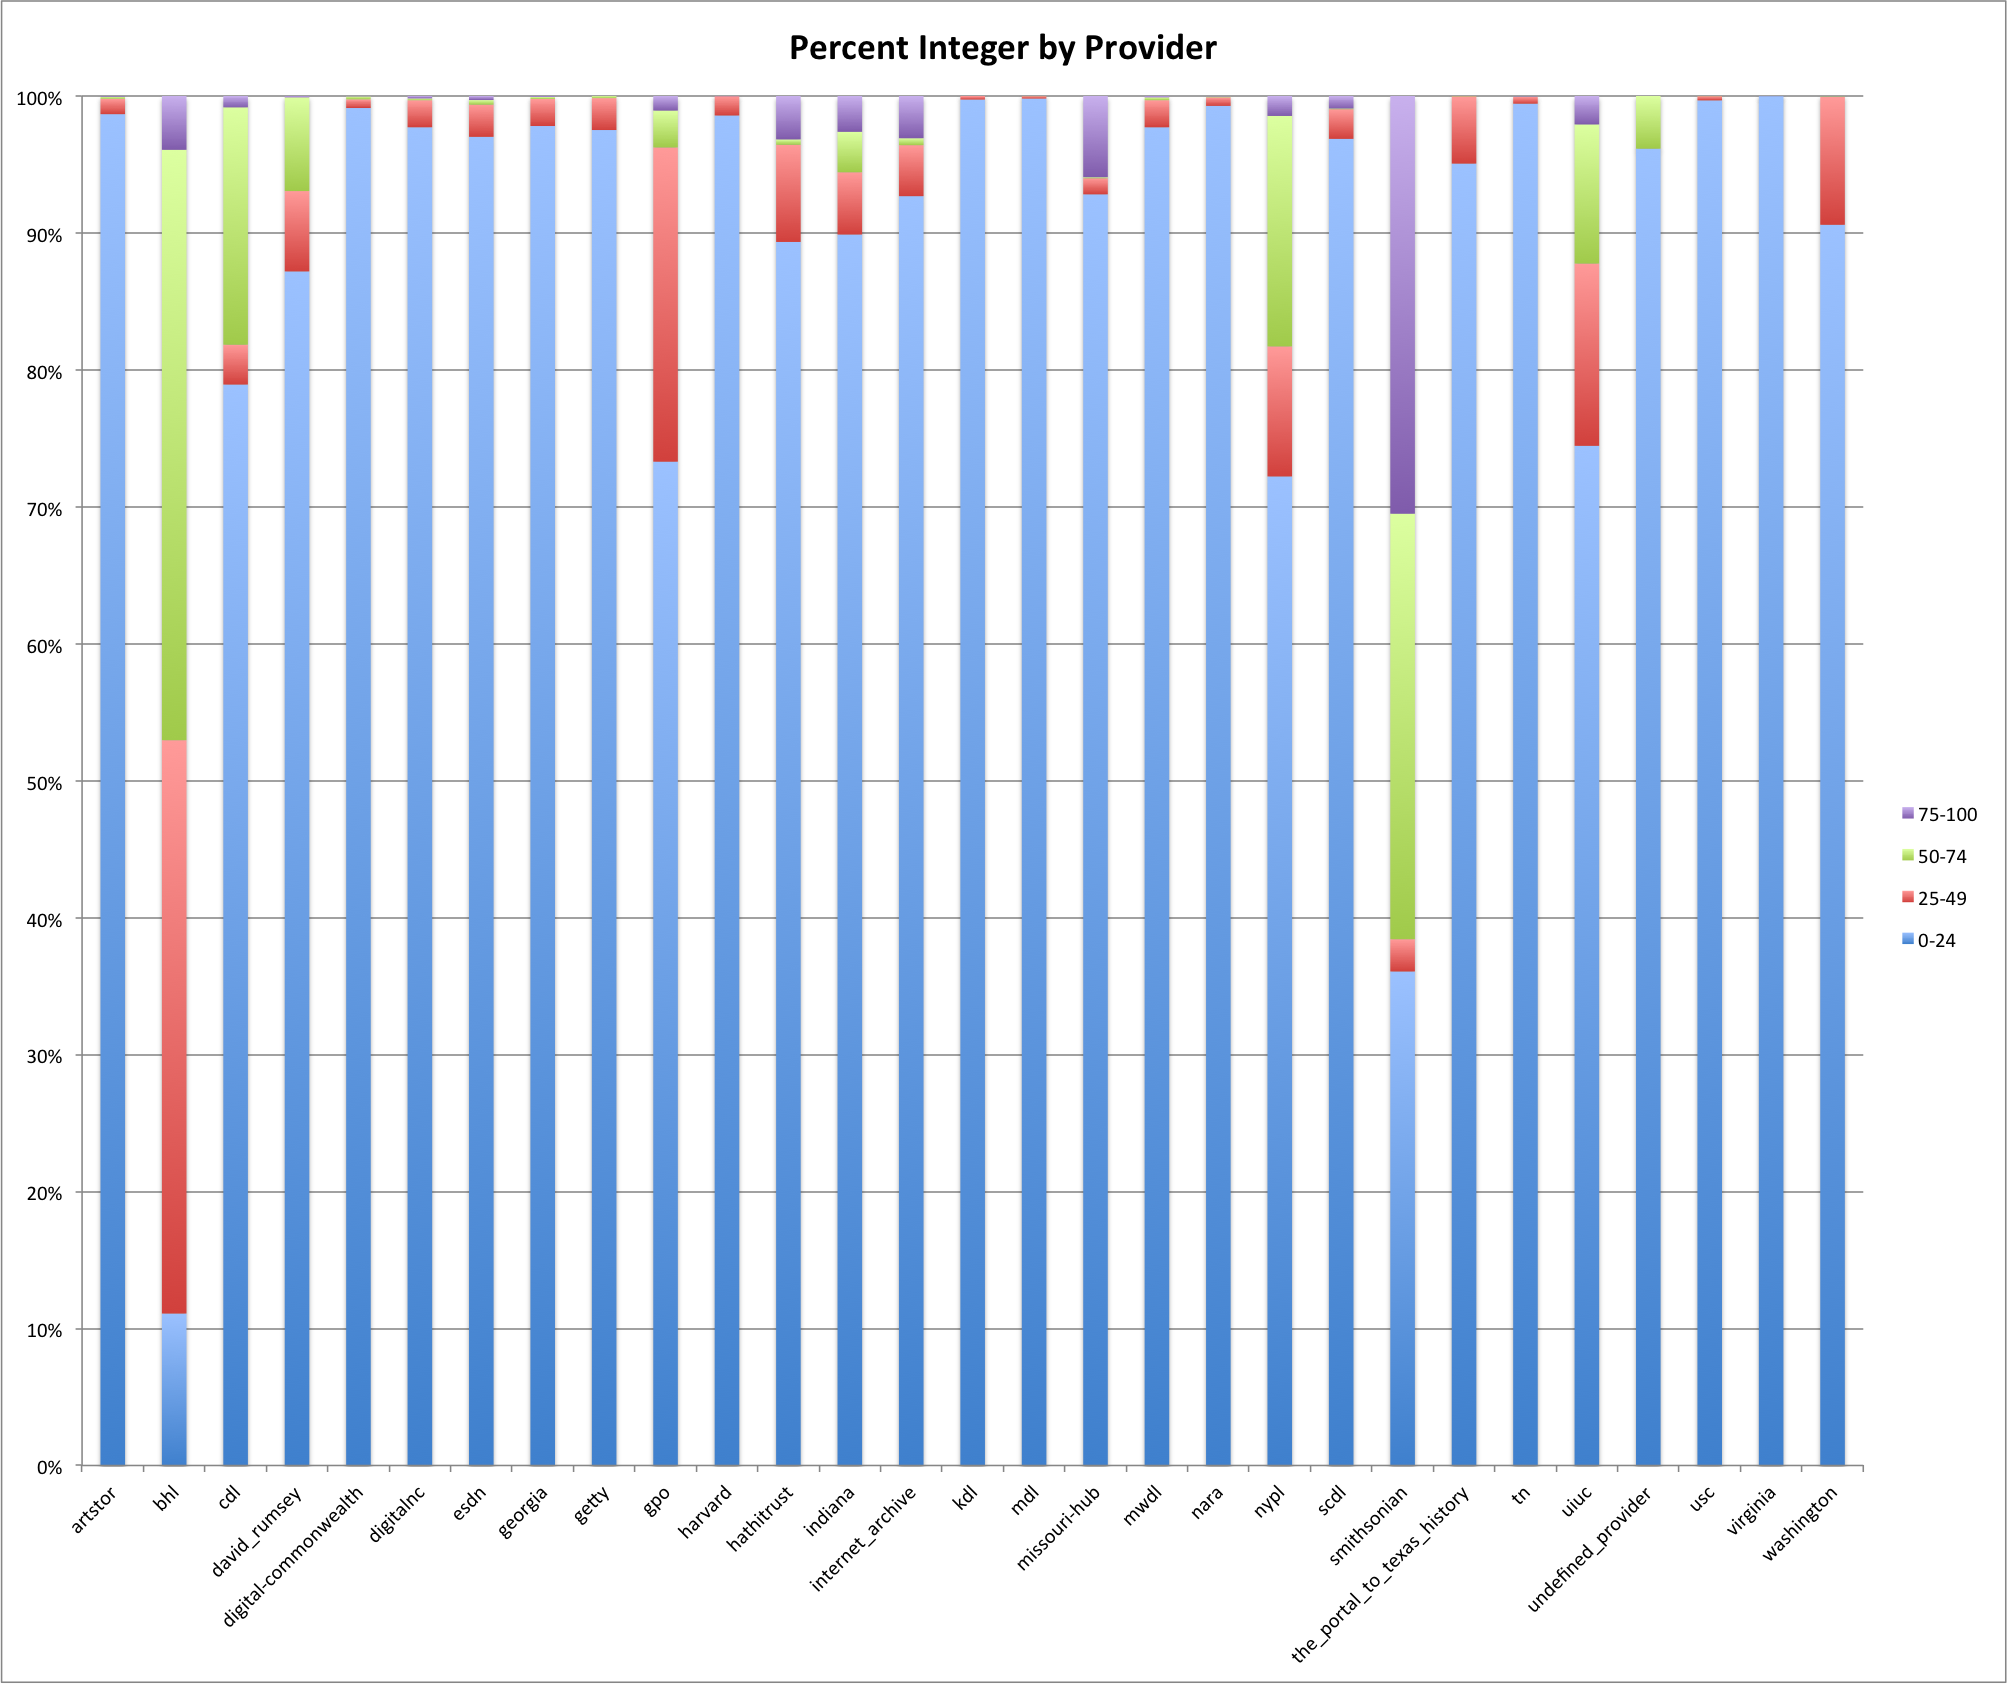
Percent Integer by Provider
You can see that there are several providers/hubs that have quite a high percentage integer for their descriptions. These providers/hubs are the bhl and the smithsonian. The smithsonian has over 70% of its descriptions with percent integers of over 70%.
Letters
Once we’ve looked at punctuation and integers, that leaves really just letters of the alphabet to makeup the rest of a description field.
That’s exactly what we will look at next. For this I used the following characters to define letters.
abcdefghijklmnopqrstuvwxyzABCDEFGHIJKLMNOPQRSTUVWXYZ
I didn’t perform any case folding so letters with diacritics wouldn’t be counted as letters in this analysis, but we will look at those a little bit later.
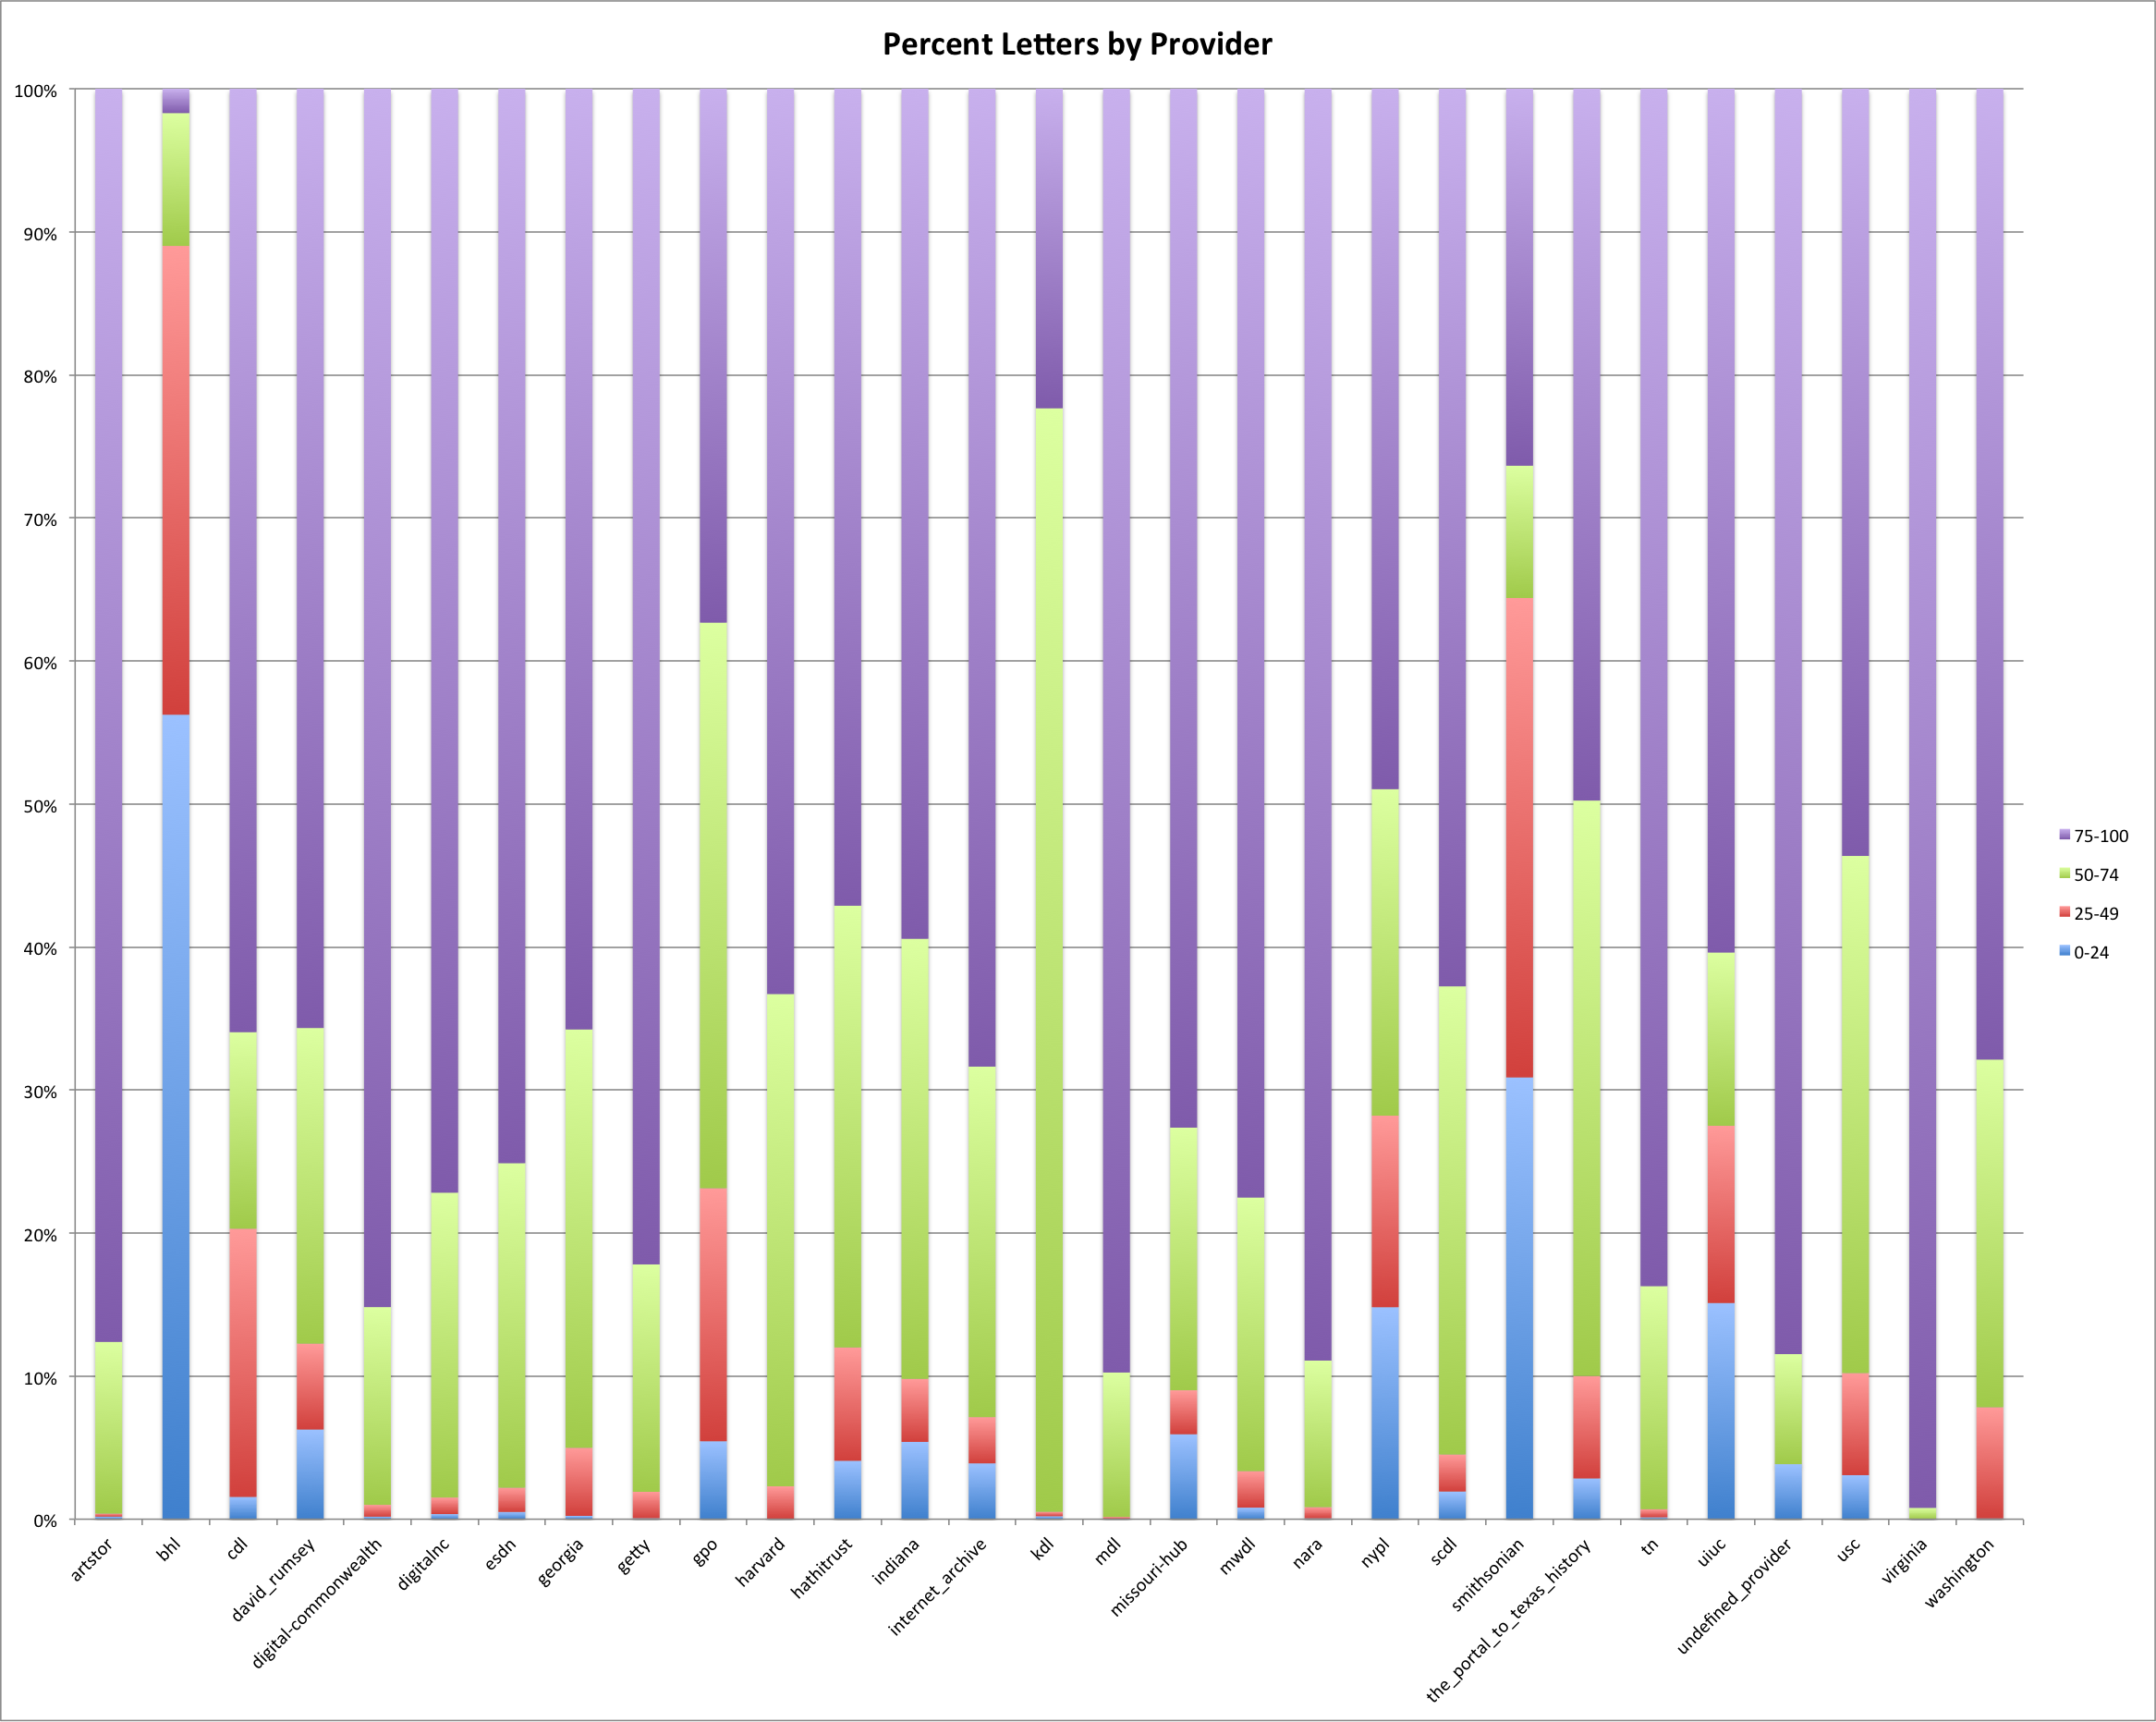
Percent Letter by Provider
For percent letters you would expect there to be a very high percentage of the descriptions that themselves contain a high percentage of letters in the description. Generally this appears to be true but there are some odd providers/hubs again mainly bhl and the smithsonian, though nypl, kdl and gpo also seem to have a different distribution of letters than others in the dataset.
Special Characters
The next thing to look at was the percentage of “special characters” used in a description. For this I used the following definition of “special character”. If a character is not present in the following list of characters (which also includes whitespace characters) then it is considered to be a “special character”
0123456789abcdefghijklmnopqrstuvwxyzABCDEFGHIJKLMNOPQRSTUVWXYZ
!"#$%&'()*+,-./:;<=>?@[\]^_`{|}~
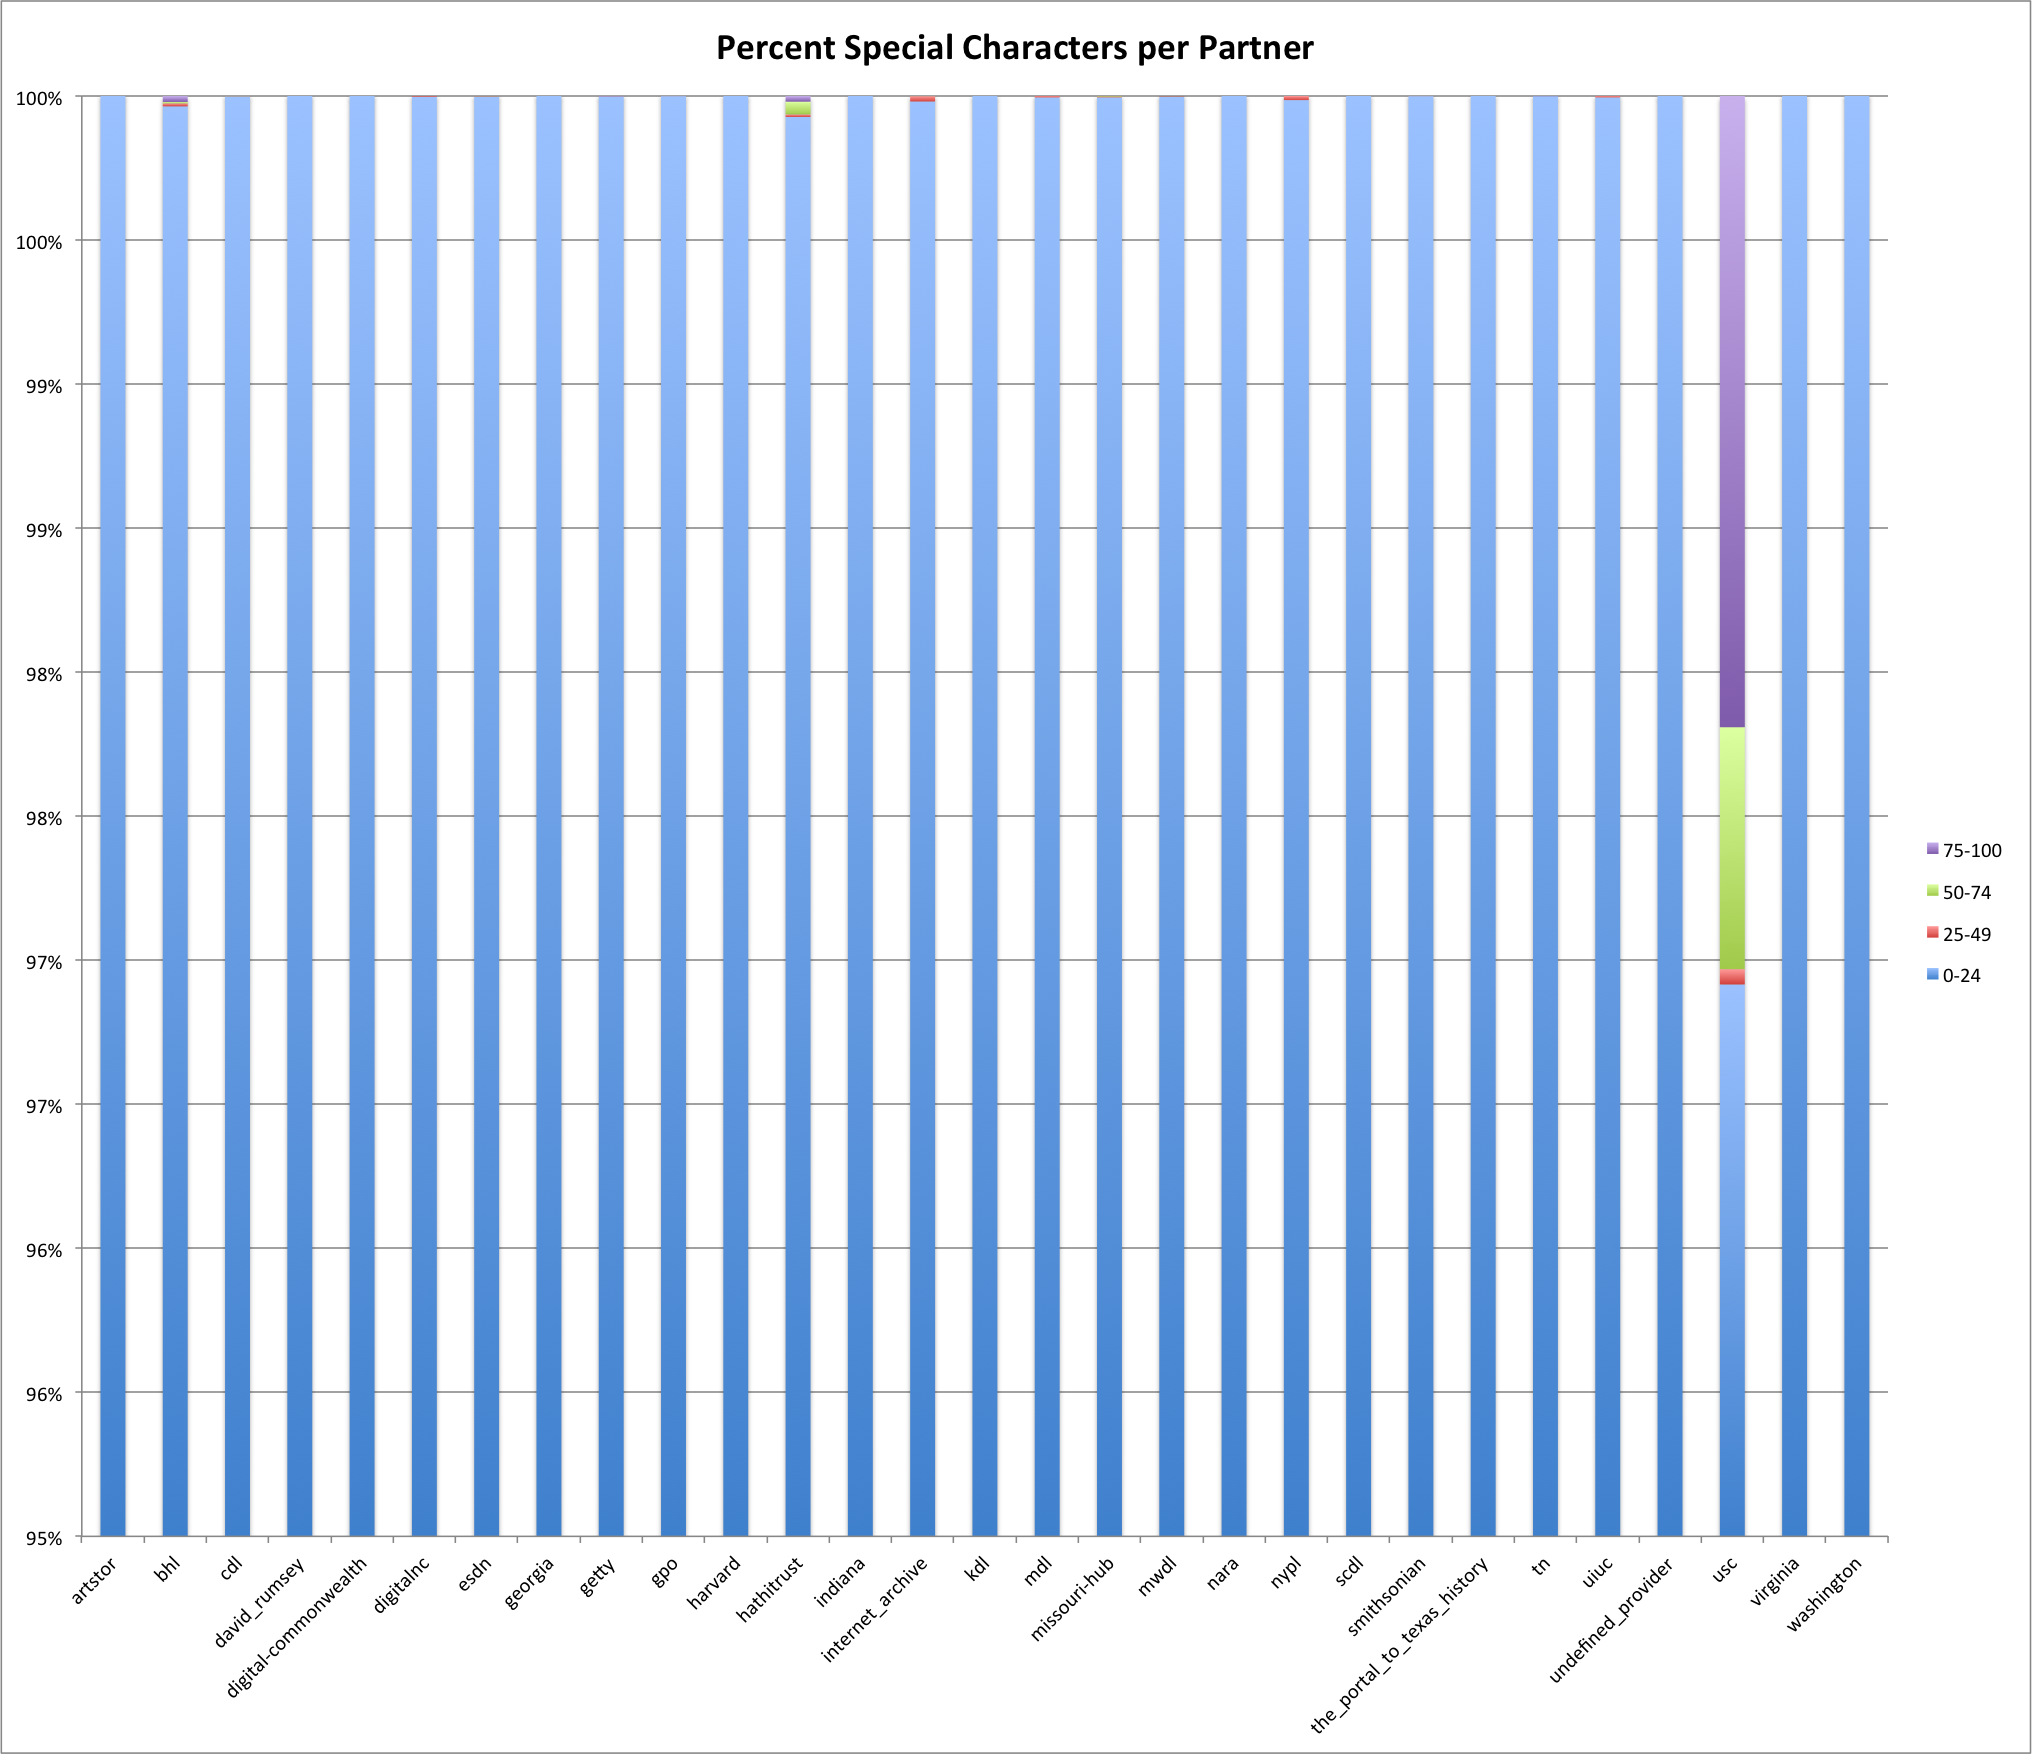
Percent Special Character by Provider
A note in reading the graph above, keep in mind that the y-axis is only 95-100% so while USC looks different here it only represents 3% of its descriptions that have 50-100% of the description being special characters. Most likely a set of descriptions that have metadata created in a non-english language.
URLs
The final graph I want to look at in this post is the percentage of descriptions for a provider/hub that has a URL present in its description. I used the presence of either http:// or https:// in the description to define if it does or doesn’t have a URL present.
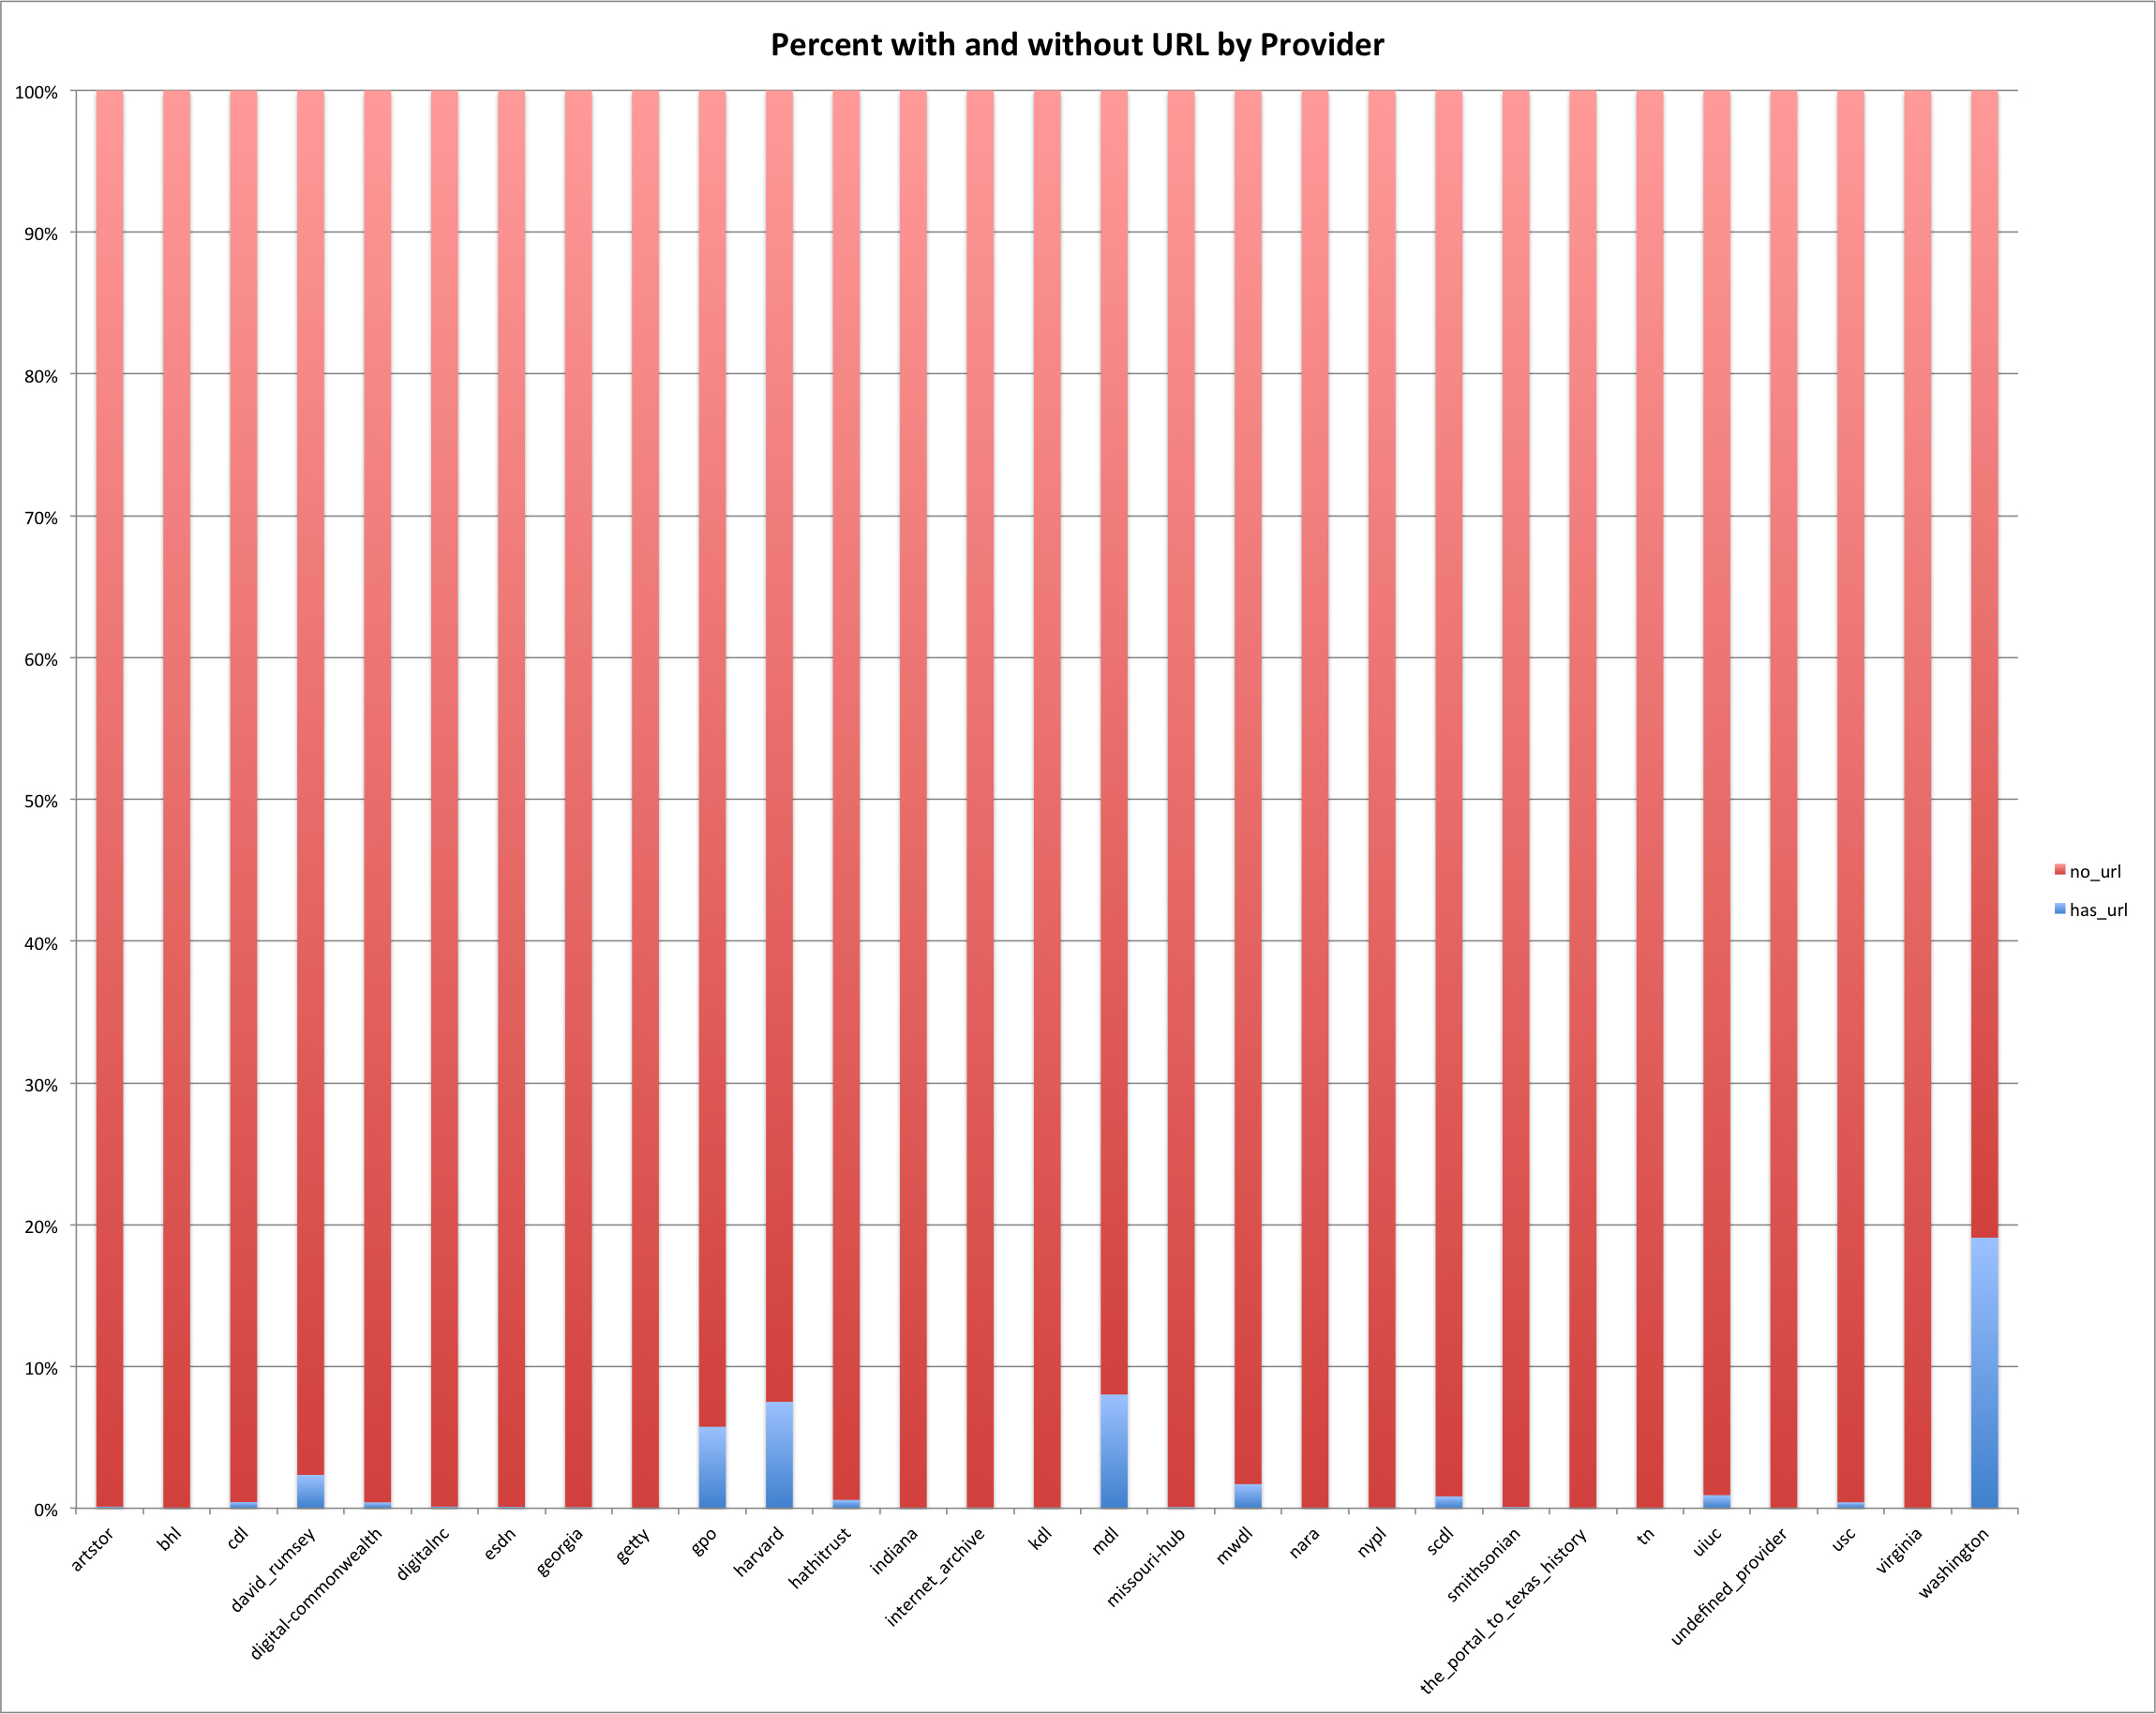
Percent URL by Provider
The majority providers/hubs don’t have URLs in their descriptions with a few obvious exceptions. The provider/hubs of washington, mwdl, harvard, gpo and david_ramsey do have a reasonable number of descriptions with URLs with washington leading with almost 20% of their descriptions having a URL present.
Again this analysis is just looking at what high-level information about the descriptions can tell us. The only metric we’ve looked at that actually goes into the content of the description field to pull out a little bit of meaning is the percent stopwords. I have one more post in this series before we wrap things up and then we will leave descriptions in the DPLA along for a bit.
If you have questions or comments about this post, please let me know via Twitter.