This is the fourth post in a series that looks at the End of Term Web Archives captured in 2008 and 2012. In previous posts I’ve looked at the when, what, and where of these archives. In doing so I pulled together the domain names from each of the archives to compare them.
My thought was that I could look at which domains had content in the EOT2008 or EOT2012 and compare these domains to get some very high level idea of what content was around in 2008 but was completely gone in 2012. Likewise I could look at new content domains that appeared since 2008. For this post I’m limiting my view to just the domains that end in .gov or .mil because they are generally the focus of these web archiving projects.
Comparing EOT2008 and EOT2012
The are 1,647 unique domain names in the EOT2008 archive and 1,944 unique domain names in the EOT2012 archive, which is an increase of 18%. Between the two archives there are 1,236 domain names that are common. There are 411 domains that exist in the EOT2008 that are not present in EOT2012, and 708 new domains in EOT2012 that didn’t exist in EOT2008.
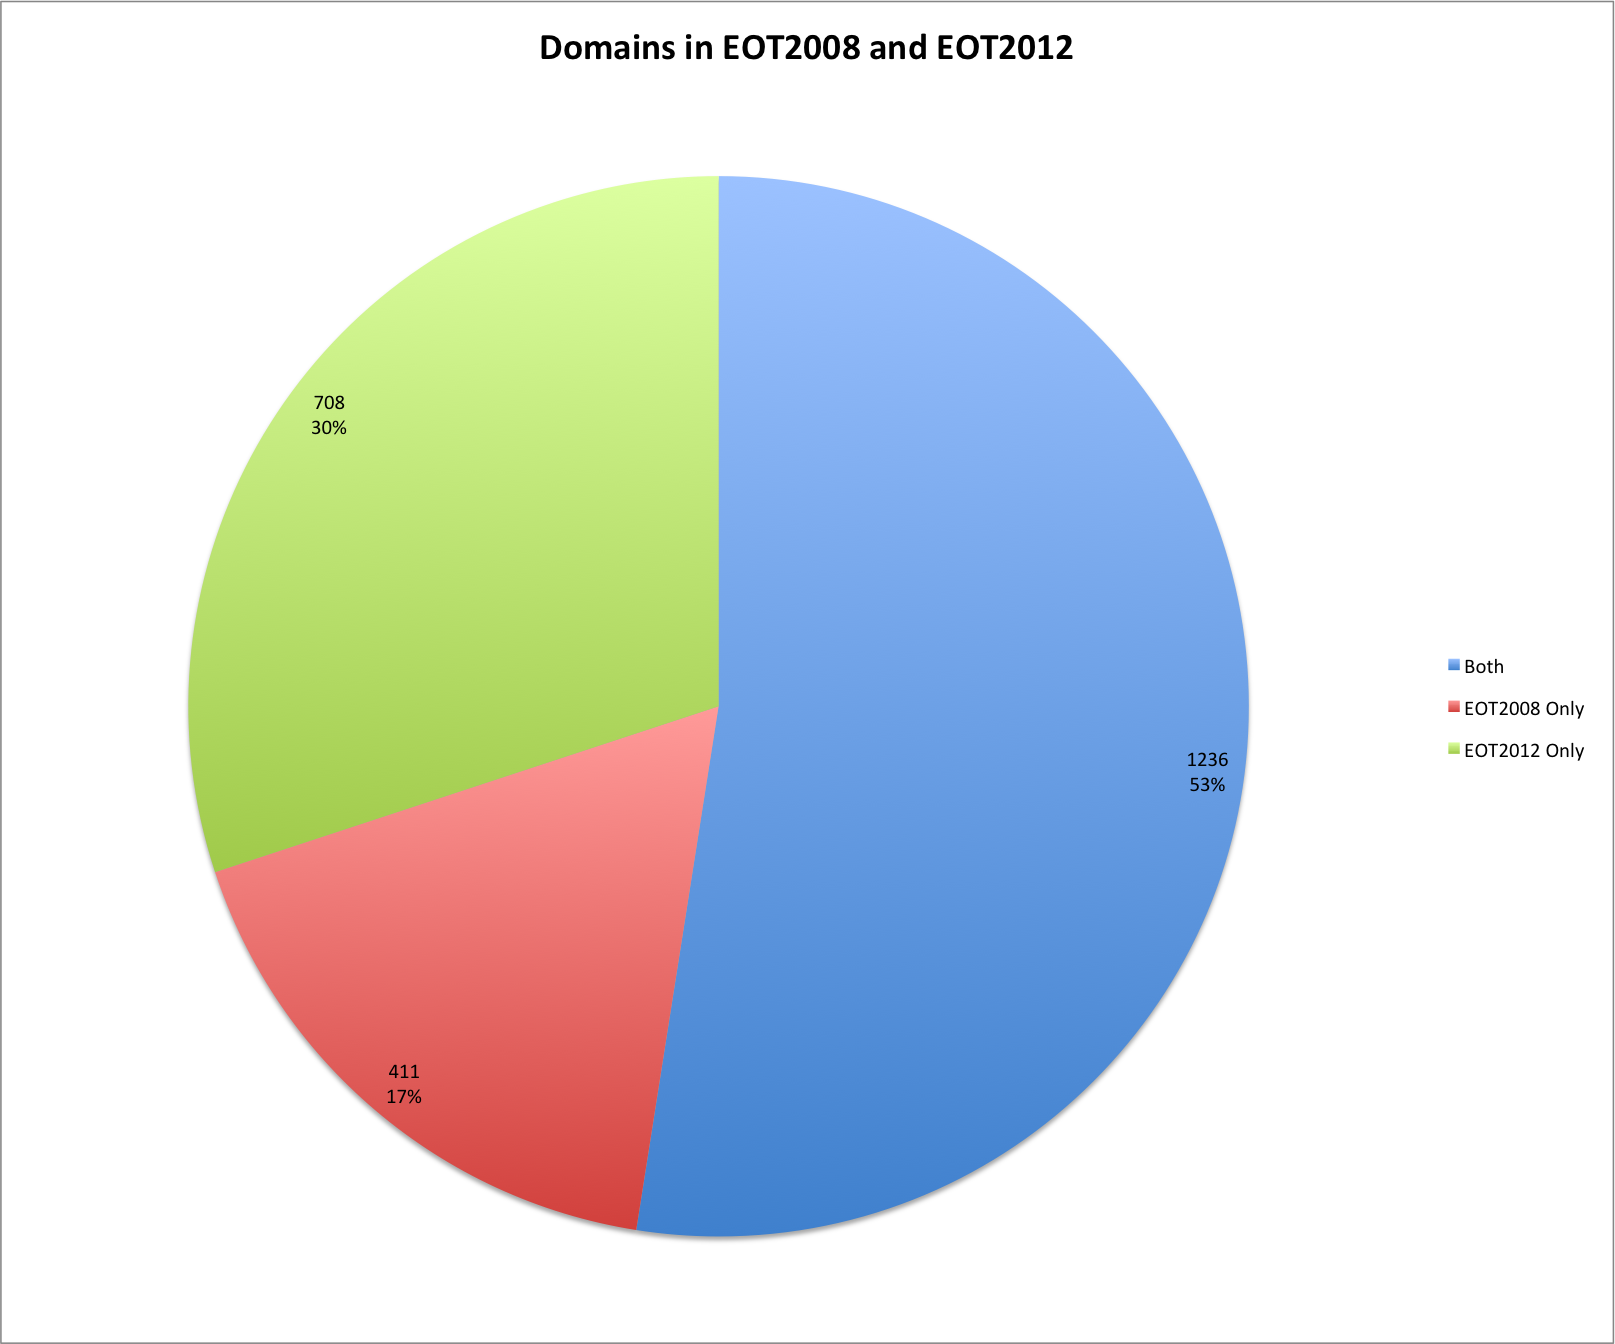
Domains in EOT2008 and E0T2012
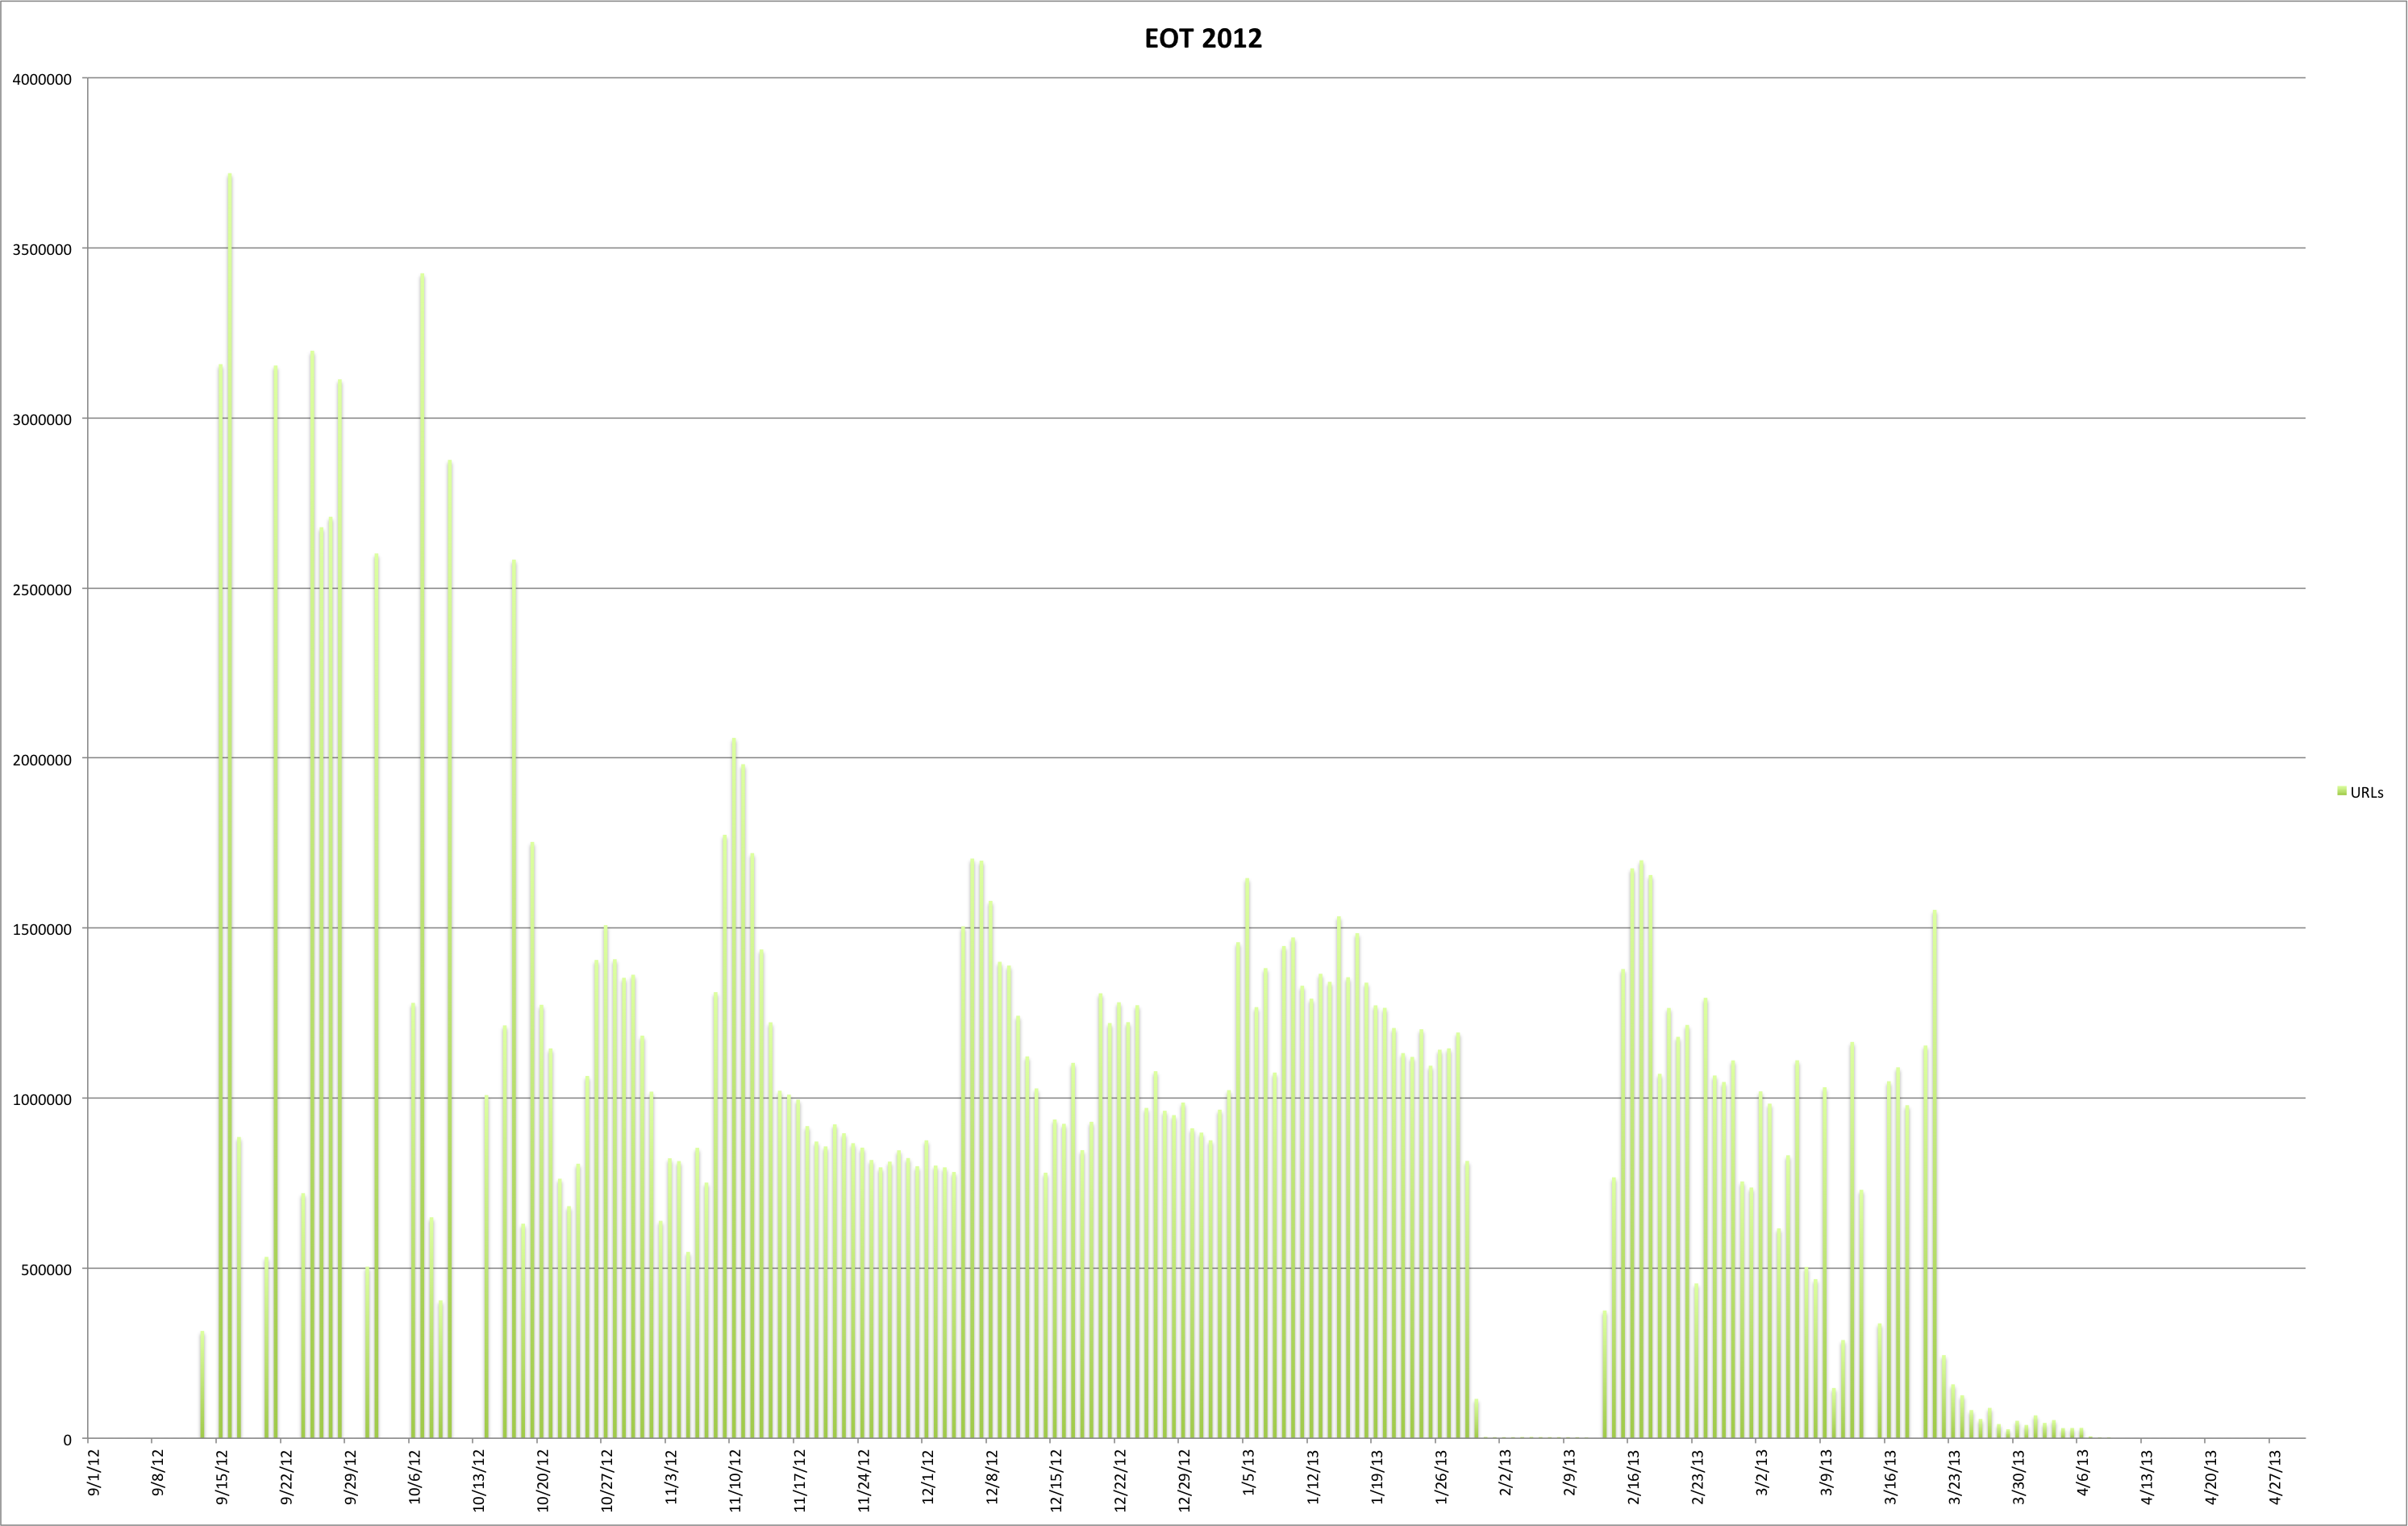
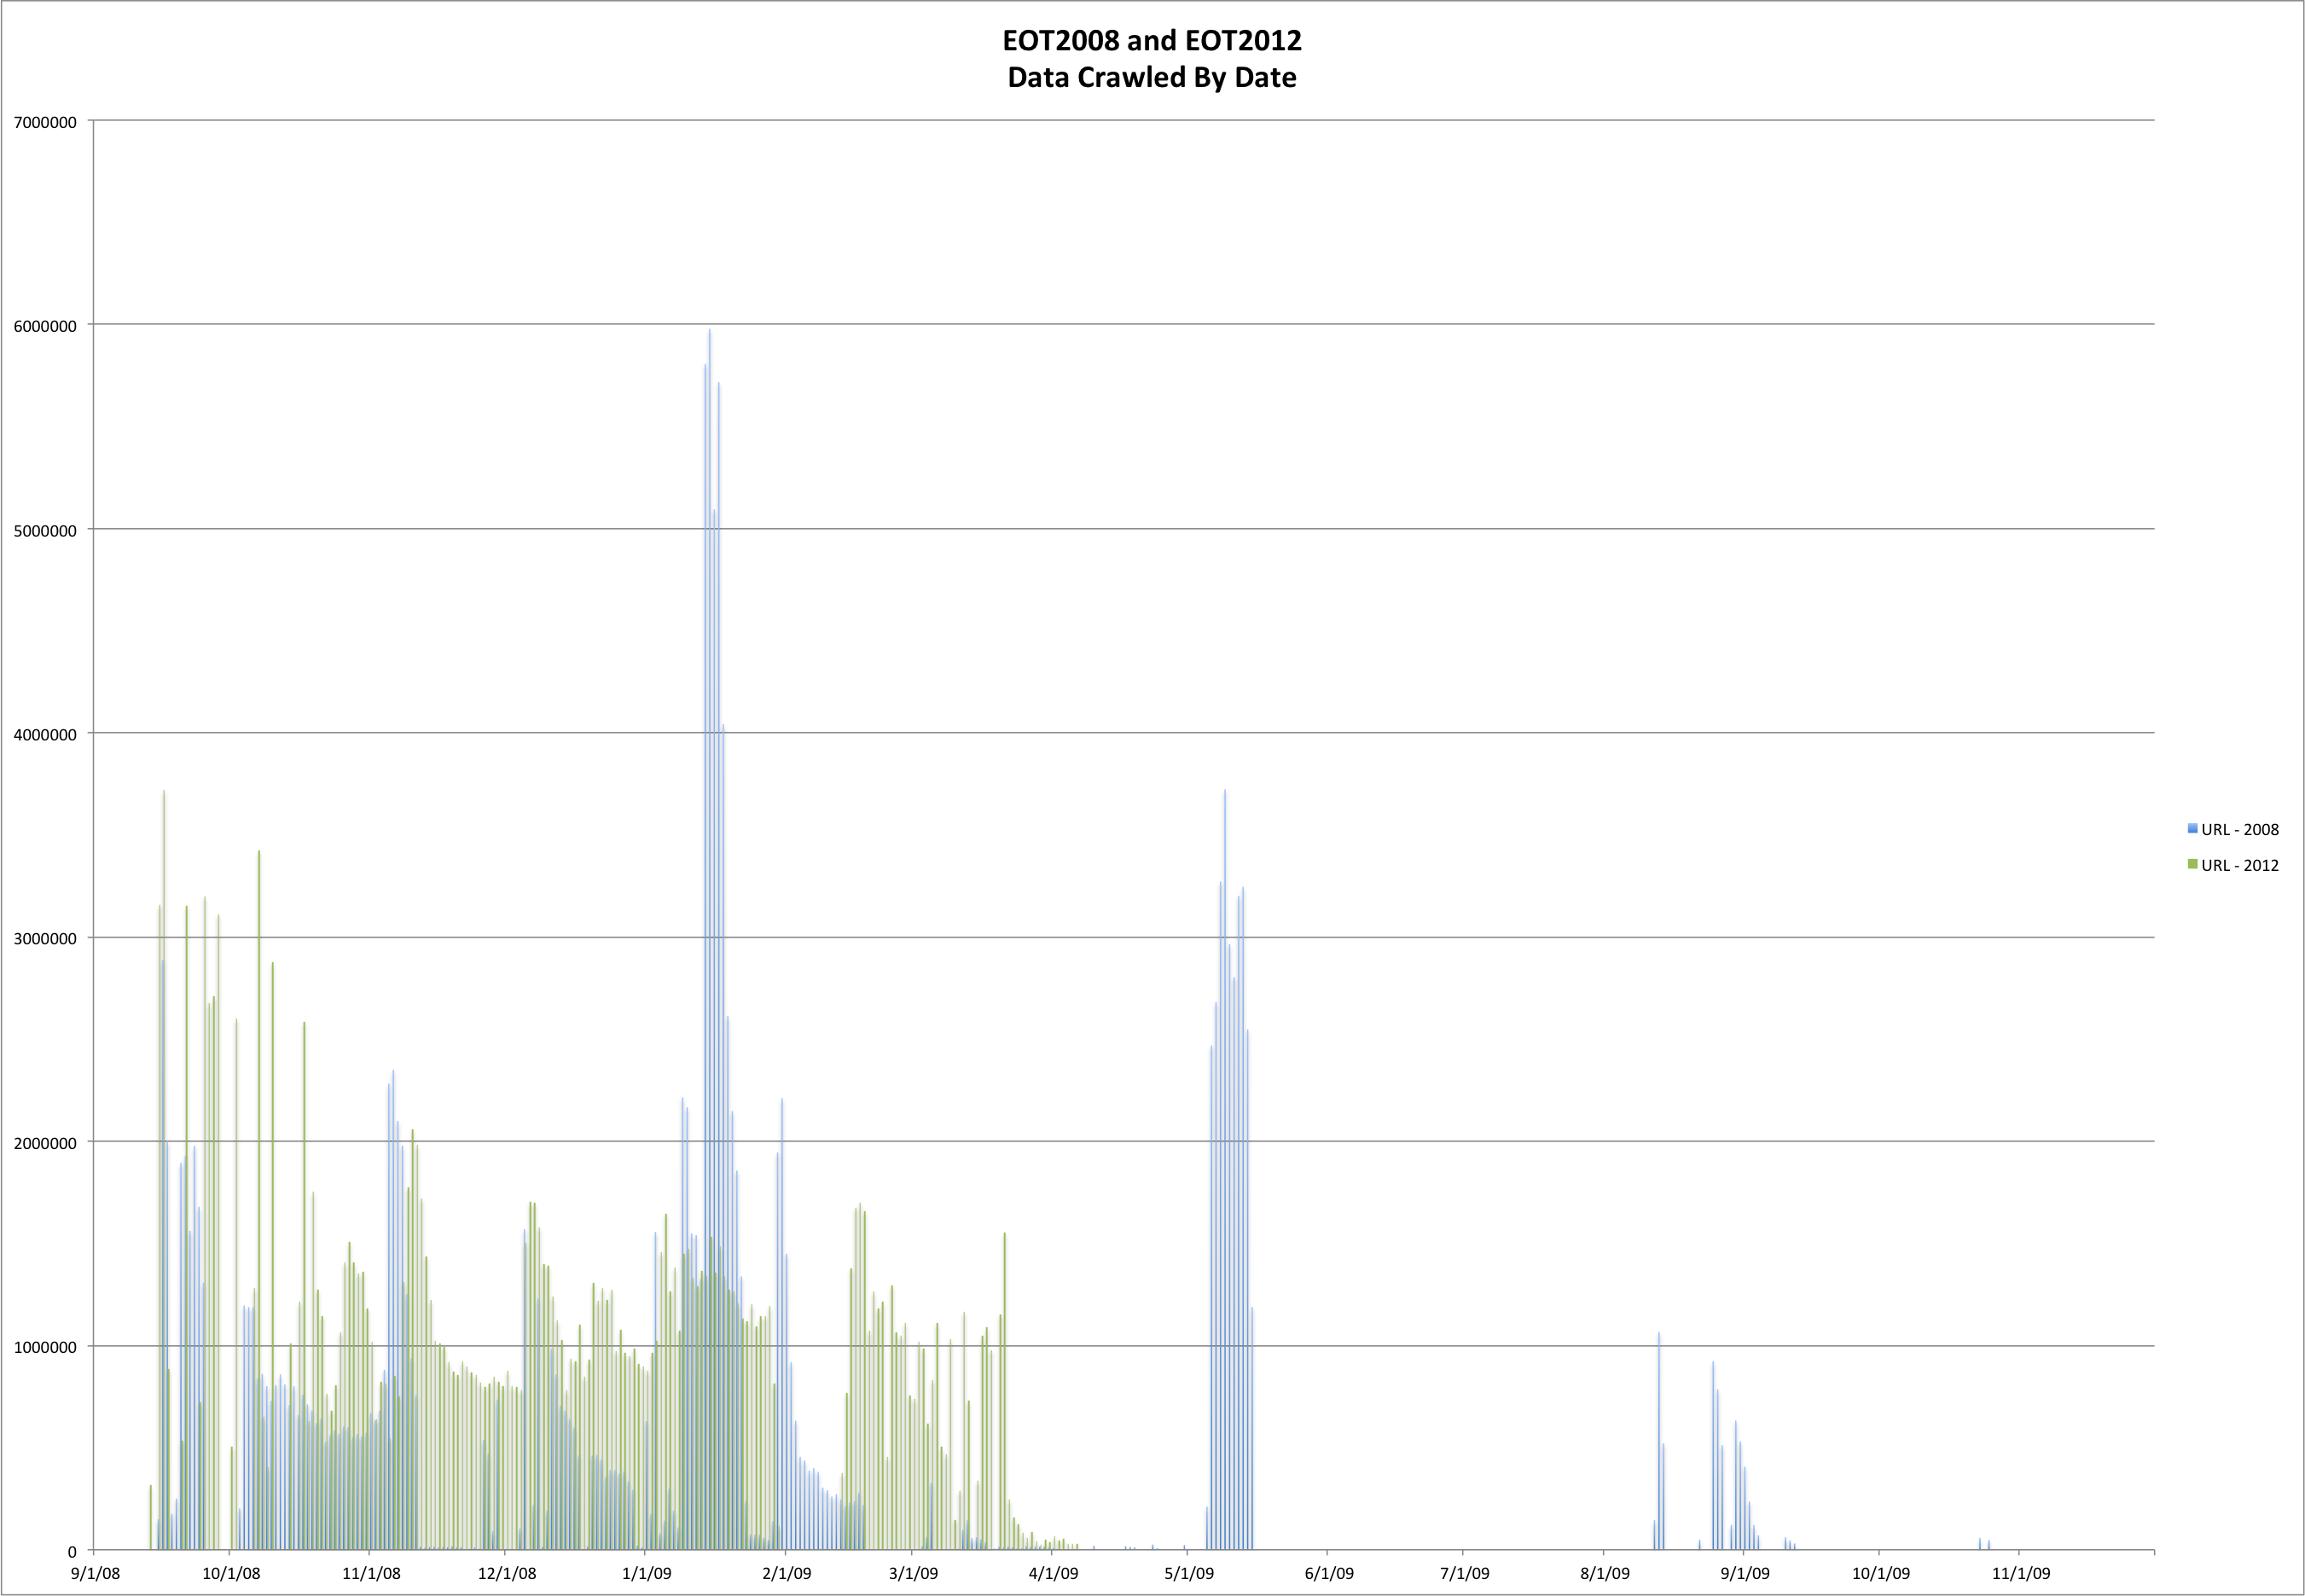
The EOT2008 dataset consists of 160,212,141 URIs and the EOT2012 dataset comes in at 194,066,940 URIs. When you look at the URLs in the 411 domains that are present in EOT2008 and missing in EOT2012 you get 3,784,308 which is just 2% of the total number of URLs. When you look at the EOT2012 domains that were only present in 2012 compared to 2008 you see 5,562,840 URLs (3%) that were harvested from domains that only existed in the EOT2012 archive.
The thirty domains with the most URLs captured for them that were present in the EOT2008 collection that weren’t present in EOT2012 are listed in the table below.
| Domain | Count |
| geodata.gov | 812,524 |
| nifl.gov | 504,910 |
| stat-usa.gov | 398,961 |
| tradestatsexpress.gov | 243,729 |
| arnet.gov | 174,057 |
| acqnet.gov | 171,493 |
| dccourts.gov | 161,289 |
| web-services.gov | 137,202 |
| metrokc.gov | 132,210 |
| sdi.gov | 91,887 |
| davie-fl.gov | 88,123 |
| belmont.gov | 87,332 |
| aftac.gov | 84,507 |
| careervoyages.gov | 57,192 |
| women-21.gov | 56,255 |
| egrpra.gov | 54,775 |
| 4women.gov | 45,684 |
| 4woman.gov | 42,192 |
| nypa.gov | 36,099 |
| nhmfl.gov | 27,569 |
| darpa.gov | 21,454 |
| usafreedomcorps.gov | 18,001 |
| peacecore.gov | 17,744 |
| californiadesert.gov | 15,172 |
| arpa.gov | 15,093 |
| okgeosurvey1.gov | 14,595 |
| omhrc.gov | 14,594 |
| usafreedomcorp.gov | 14,298 |
| uscva.gov | 13,627 |
| odci.gov | 12,920 |
The thirty domains with the most URLs from EOT2012 that weren’t present in EOT2012.
| Domain | Count |
| militaryonesource.mil | 859,843 |
| consumerfinance.gov | 237,361 |
| nrd.gov | 194,215 |
| wh.gov | 179,233 |
| pnnl.gov | 132,994 |
| eia.gov | 112,034 |
| transparency.gov | 109,039 |
| nationalguard.mil | 108,854 |
| acus.gov | 93,810 |
| 404.gov | 82,409 |
| savingsbondwizard.gov | 76,867 |
| treasuryhunt.gov | 76,394 |
| fedshirevets.gov | 75,529 |
| onrr.gov | 75,484 |
| veterans.gov | 75,350 |
| broadbandmap.gov | 72,889 |
| saferproducts.gov | 65,387 |
| challenge.gov | 63,808 |
| healthdata.gov | 63,105 |
| marinecadastre.gov | 62,882 |
| fatherhood.gov | 62,132 |
| edpubs.gov | 58,356 |
| transportationresearch.gov | 58,235 |
| cbca.gov | 56,043 |
| usbonds.gov | 55,102 |
| usbond.gov | 54,847 |
| phe.gov | 53,626 |
| ussavingsbond.gov | 53,563 |
| scienceeducation.gov | 53,468 |
| mda.gov | 53,010 |
Shared domains that changed
There were a number of domains (1,236) that are present in both the EOT2008 and EOT2012 archives. I thought it would be interesting to compare those domains and see which ones changed the most. Below are the fifty shared domains that changed the most between EOT2008 and EOT2012.
| Domain | EOT2008 | EOT2012 | Change | Absolute Change | % Change |
| house.gov | 13,694,187 | 35,894,356 | 22,200,169 | 22,200,169 | 162% |
| senate.gov | 5,043,974 | 9,924,917 | 4,880,943 | 4,880,943 | 97% |
| gpo.gov | 8,705,511 | 3,888,645 | -4,816,866 | 4,816,866 | -55% |
| nih.gov | 5,276,262 | 1,267,764 | -4,008,498 | 4,008,498 | -76% |
| nasa.gov | 6,693,542 | 3,063,382 | -3,630,160 | 3,630,160 | -54% |
| navy.mil | 94,081 | 3,611,722 | 3,517,641 | 3,517,641 | 3,739% |
| usgs.gov | 4,896,493 | 1,690,295 | -3,206,198 | 3,206,198 | -65% |
| loc.gov | 5,059,848 | 7,587,179 | 2,527,331 | 2,527,331 | 50% |
| hhs.gov | 2,361,866 | 366,024 | -1,995,842 | 1,995,842 | -85% |
| osd.mil | 180,046 | 2,111,791 | 1,931,745 | 1,931,745 | 1,073% |
| af.mil | 230,920 | 2,067,812 | 1,836,892 | 1,836,892 | 795% |
| ed.gov | 2,334,548 | 510,413 | -1,824,135 | 1,824,135 | -78% |
| lanl.gov | 2,081,275 | 309,007 | -1,772,268 | 1,772,268 | -85% |
| usda.gov | 2,892,923 | 1,324,049 | -1,568,874 | 1,568,874 | -54% |
| congress.gov | 1,554,199 | 40,338 | -1,513,861 | 1,513,861 | -97% |
| noaa.gov | 5,317,872 | 3,985,633 | -1,332,239 | 1,332,239 | -25% |
| epa.gov | 1,628,517 | 327,810 | -1,300,707 | 1,300,707 | -80% |
| uscourts.gov | 1,484,240 | 184,507 | -1,299,733 | 1,299,733 | -88% |
| dol.gov | 1,387,724 | 88,557 | -1,299,167 | 1,299,167 | -94% |
| census.gov | 1,604,505 | 328,014 | -1,276,491 | 1,276,491 | -80% |
| dot.gov | 1,703,935 | 554,325 | -1,149,610 | 1,149,610 | -67% |
| usbg.gov | 1,026,360 | 6,724 | -1,019,636 | 1,019,636 | -99% |
| doe.gov | 1,164,955 | 268,694 | -896,261 | 896,261 | -77% |
| vaccines.mil | 5,665 | 856,188 | 850,523 | 850,523 | 15,014% |
| fdlp.gov | 991,747 | 156,499 | -835,248 | 835,248 | -84% |
| uspto.gov | 980,215 | 155,428 | -824,787 | 824,787 | -84% |
| bts.gov | 921,756 | 130,730 | -791,026 | 791,026 | -86% |
| cdc.gov | 1,014,213 | 264,500 | -749,713 | 749,713 | -74% |
| lbl.gov | 743,472 | 4,080 | -739,392 | 739,392 | -99% |
| faa.gov | 945,446 | 206,500 | -738,946 | 738,946 | -78% |
| treas.gov | 838,243 | 99,411 | -738,832 | 738,832 | -88% |
| fema.gov | 903,393 | 172,055 | -731,338 | 731,338 | -81% |
| clinicaltrials.gov | 919,490 | 196,642 | -722,848 | 722,848 | -79% |
| army.mil | 2,228,691 | 2,936,308 | 707,617 | 707,617 | 32% |
| nsf.gov | 760,976 | 65,880 | -695,096 | 695,096 | -91% |
| prc.gov | 740,176 | 75,682 | -664,494 | 664,494 | -90% |
| doc.gov | 823,825 | 173,538 | -650,287 | 650,287 | -79% |
| fueleconomy.gov | 675,522 | 79,943 | -595,579 | 595,579 | -88% |
| nbii.gov | 577,708 | 391 | -577,317 | 577,317 | -100% |
| defense.gov | 687 | 575,776 | 575,089 | 575,089 | 83,710% |
| usajobs.gov | 3,487 | 551,217 | 547,730 | 547,730 | 15,708% |
| sandia.gov | 736,032 | 210,429 | -525,603 | 525,603 | -71% |
| nps.gov | 706,323 | 191,102 | -515,221 | 515,221 | -73% |
| defenselink.mil | 502,023 | 1,868 | -500,155 | 500,155 | -100% |
| fws.gov | 625,180 | 132,402 | -492,778 | 492,778 | -79% |
| ssa.gov | 609,784 | 125,781 | -484,003 | 484,003 | -79% |
| archives.gov | 654,689 | 175,585 | -479,104 | 479,104 | -73% |
| fnal.gov | 575,167 | 1,051,926 | 476,759 | 476,759 | 83% |
| change.gov | 486,798 | 24,820 | -461,978 | 461,978 | -95% |
| buyusa.gov | 490,179 | 37,053 | -453,126 | 453,126 | -92% |
Only 11 of the 50 (22%) resulted in more content harvested in EOT2012 than EOT2012.
Of the eleven domains that had more content harvested for them in EOT2012 there were five navy.mil, osd.mil, vaccines.mil, defense.gov, and usajobs.gov that increased by over 1,000% in the amount of content. I don’t know if this is necessarily a result in an increase in attention to these sites, more content on the sites, or a different organization of the sites that made them easier to harvest. I suspect it is some combination of all three of those things.
Summary
It should be expected that there are going to be domains that come into and go out of existence on a regular basis in a large web space like the federal government. One of the things that I think is rather challenging to identify is a list of domains that were present at one given time within an organization. For example “what domains did the federal government have in 1998?”. It seems like a way to come up with that answer is to use web archives. We see based on the analysis in this post that there are 411 domains that were present in 2008 that we weren’t able to capture in 2012. Take a look at that list of the top thirty, did you recognize any of those? How many other initiatives, committees, agencies, task forces, and citizen education portals existed at one point that are now gone?
If you have questions or comments about this post, please let me know via Twitter.