One thing that tends to be hard in the digital library world is to understand how a given program is doing in relation to other programs throughout the country. This information can be helpful to help justify funds spent locally on digital library initiatives. The same information can be used within a department to understand if workflows are on par with others throughout the country/region.
Most often the numbers that are reported are those that are required by membership groups such as ARL, ACRL and others who have a token question or two about digital library statistics but most people involved with those numbers know that they are often…. unclear at best.
Some of the dimensions that are available to look at include traffic to the digital library system, visitors, page views, time on site, referral traffic. Locally we use Google Analytics for this data at the repository level. How a digital libraries items get used is also another metric that is helpful in knowing the impact of these resources. This can be measured in a wide range of ways and there are initiatives such as Counter that provide some guidance to this sort of work but it feels like it is more focused on “Electronic Resources” and doesn’t really handle the range of cases we run into in digital library/repository land. The University of Florida Digital Collections makes their usage data for each item in the collection easily obtainable, many modern DSpace instances also have great reporting on usage of items. I’ve talked a little about how UNT Libraries calculates “uses” for our digital library collections here and here. The final area that is often reported on is the collection growth of the repository either in the number of items added, number of bytes (or GB, TB) added, or number of files added in a given year.
I think walking through some of these metrics in a series of posts will be helpful for me to articulate some of the opportunities that are available if the digital libraries/repository community openly shared more of this data. There are of course organizations such as Hathi Trust, the Digital Public Library of America, and others who make growth data available front and center, but for most of our repositories it is pretty hidden.
The data that I’m showing in this post is from the UNT Libraries Digital Collections which contains three separate digital library interfaces, The Portal to Texas History, the UNT Digital Library, and the Gateway to Oklahoma History. All three of these interfaces are powered by the same repository infrastructure on the backend and are made searchable by a unified Solr index. The datasets here are from that Solr instance directly.
Items added per month
From Jan 1 to Dec 31, 2014 the UNT Libraries Digital Collections added 417,645 unique digital resources to its holdings. The breakdown of the monthly additions look like this:
| Month | Items Added |
| January | 32,074 |
| February | 9,220 |
| March | 7,758 |
| April | 11,161 |
| May | 11,475 |
| June | 32,549 |
| July | 18,503 |
| August | 67,769 |
| September | 83,916 |
| October | 25,537 |
| November | 73,404 |
| December | 44,279 |
A better way to look at this might be a simple chart.
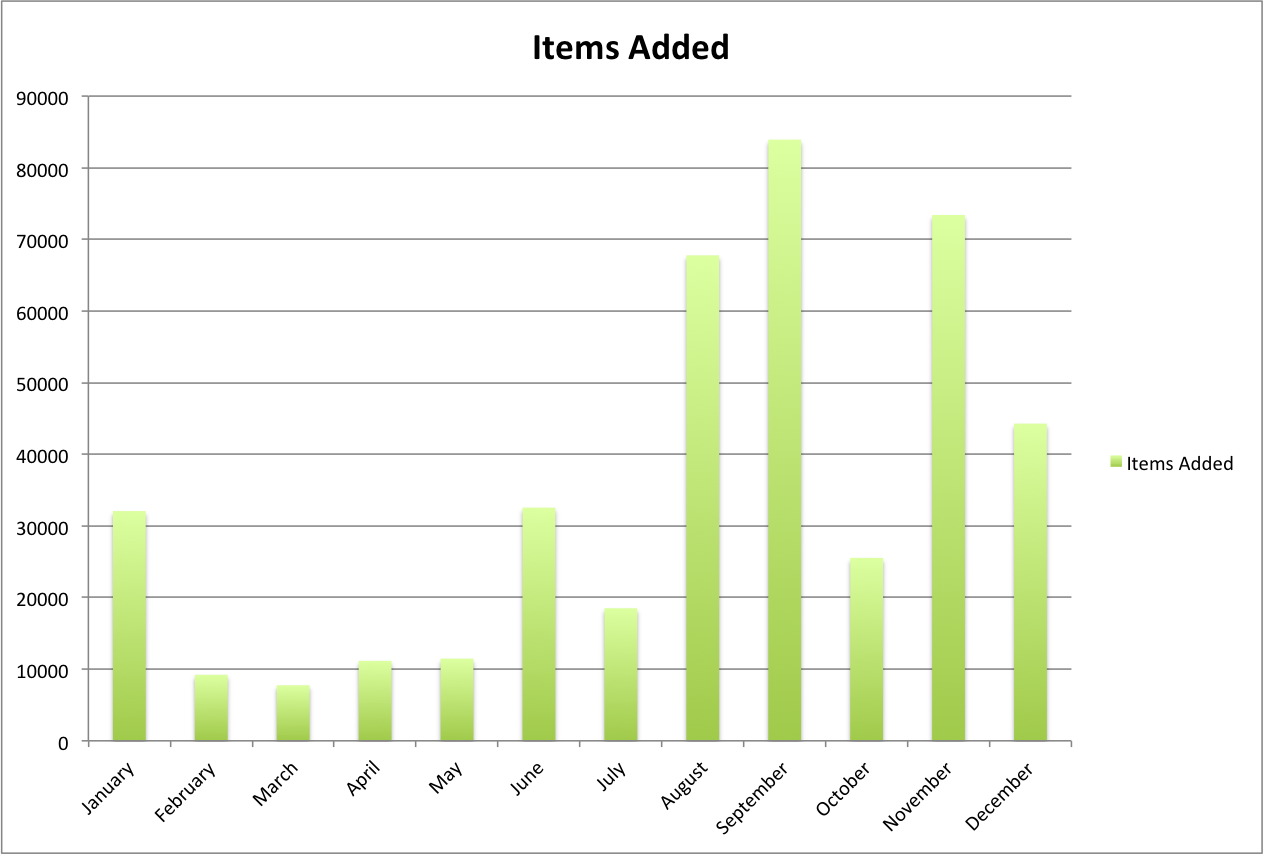
UNT Libraries Digital Collections: Growth by Month in 2014
Or looked at a different way.
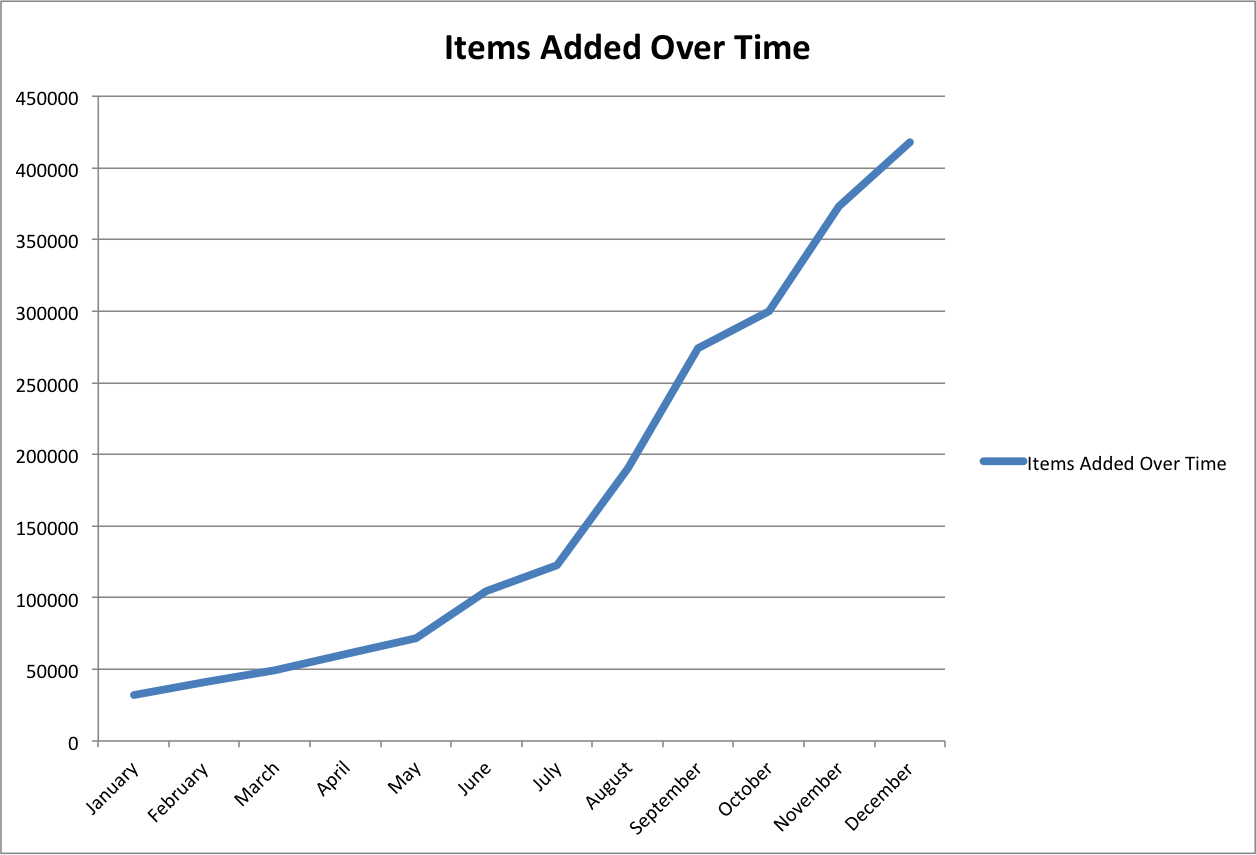
The average number of items added to the system in 2014 by month is 34,803.
Wait, What is an Item,Object,Resource
A little side trip is needed so that we are on the same page. For us a “digital object” or “digital item” or “digital resource” is an intellectual unit that a descriptive metadata record is assigned at. This may be a scan of a photographic negative, front and back scans of a physical photographic print, a book, letter, pamphlet, map, or issue of newspaper. In most instances there are multiple files/images/pages per item in our system but we are just talking about those larger units and not the files that make up the items themselves. Just wanted to make sure we were on the same page about that.
Items added per day
In looking at the daily data for the year, there were 215 days that new content was processed and added to the collection with no processing being done on 150 days. The average number of items added per day during the year was 1,144 items. If we think about an ten hour work day (roughly when the library is open for normal folks) that’s 114 items per hour, or 1.9 new items created per minute during the work week last year.
Items by Type
I thought it might be interesting to see how the 417,645 were distributed among the various resource types that we categorize records into. Here is that table.
| Resource Type | Items |
| image_photo | 197,133 |
| text_newspaper | 109,456 |
| image_map | 66,637 |
| text_report | 12,569 |
| text | 9,517 |
| text_patent | 7,052 |
| text_etd | 4,449 |
| physical-object | 3,573 |
| text_leg | 1,660 |
| text_book | 1,171 |
| text_journal | 1,063 |
| video | 804 |
| text_article | 494 |
| image_postcard | 366 |
| collection | 347 |
| text_pamphlet | 346 |
| text_letter | 235 |
| text_legal | 216 |
| text_yearbook | 180 |
| image_presentation | 96 |
| image_artwork | 44 |
| text_clipping | 44 |
| dataset | 36 |
| image_poster | 30 |
| image | 26 |
| text_paper | 23 |
| image_score | 22 |
| sound | 17 |
| website | 13 |
| text_review | 12 |
| text_chapter | 8 |
| text_prose | 5 |
| text_poem | 1 |
As you can see the majority of all of the items added were in the category of image_photo (Photographs) or text_newspaper (Newspapers) with those two types accounting for 73% of the new additions to the system.
Closing
As I mentioned at the beginning of this post, I think knowing metrics of other digital library programs is helpful for local initiatives in a number of ways. The UNT Libraries had a very successful year for adding new content, over the past few years we’ve been able to double the number of items each year, I don’t think that’s a rate of growth that we can keep up with but it is always fun to try. How do repository systems at your institution look in relation to this? Sharing that data more broadly would be helpful to the digital library community overall and I encourage others to take some time and make this data available.
If you have any specific questions for me let me know on twitter.