This is the last of three posts about working with the Digital Public Library of America’s (DPLA) metadata to demonstrate some of the analysis that can be done using Solr and a little bit of time and patience. Here are links to the first and second post in the series.
What I wanted to talk about in this post is how can we use this data to help improve access to our digital resources in the DPLA, and also be able to measure that we’ve in fact improved when we go out to spend resources, both time and money on metadata work.
The first thing I think we need to do is to make an assumption to frame this conversation. For now let’s say that the presence of subjects in a metadata record is a positive indicator of quality. And that for the most part a record that has three or more subjects (controlled, keywords, whatever) improves the access to resources in metadata aggregation systems like the DPLA which doesn’t have the benefit of full-text for searching.
So out of the numbers we’ve looked at so far, which ones are the ones to pay the most attention to.
Zero Subjects
For me it is focusing on the number of records that have zero subject headings that are already online. Going from 0-1 subject headings is much more of an improvement for access than going from 1-2, 2-3,3-4,4-8,8-15 subjects per record. So once we have all records with at least one subject we can move on. We can measure this directly with the metric for how many records have zero subjects that I introduced last post.
There are currently 1,827,276 records in the DPLA that have no subjects or keywords. This accounts for 23% of the DPLA dataset analyzed for these blog posts. I think this is a pretty straightforward area to work on related to metadata improvement.
Dead end subjects
One are we could work to improve is when we have subjects that are either only used once in the DPLA as a whole, or only once within a single Hub. Reducing this number would allow for more avenues for navigation between records by connecting them via subject when available. There isn’t anything bad about unique subject headings within a community, but if a record doesn’t have a way to get you to like records (assuming there are like records within a collection) then it isn’t as useful as one that connects you to more, similar items. There of course are many legitimate reasons that there is only one instance of a subject in a dataset and I don’t think that we should strive to remove them completely, but reducing the number overall would be an indicator of improvement in my book.
In the last post I had a table that had the number of unique subjects and the number of subjects that were unique to a single Hub. I was curious about the percentage of subjects from a Hub that were unique to just that Hub based on the number of unique subjects. Here is that table.
| Hub Name | Records | Unique Subjects | # of subjects unique to hub | % of subjects that are unique to hub |
| ARTstor | 56,342 | 9,560 | 4,941 | 52% |
| Biodiversity Heritage Library | 138,288 | 22,004 | 9,136 | 42% |
| David Rumsey | 48,132 | 123 | 30 | 24% |
| Digital Commonwealth | 124,804 | 41,704 | 31,094 | 75% |
| Digital Library of Georgia | 259,640 | 132,160 | 114,689 | 87% |
| Harvard Library | 10,568 | 9,257 | 7,204 | 78% |
| HathiTrust | 1,915,159 | 685,733 | 570,292 | 83% |
| Internet Archive | 208,953 | 56,911 | 28,978 | 51% |
| J. Paul Getty Trust | 92,681 | 2,777 | 1,852 | 67% |
| Kentucky Digital Library | 127,755 | 1,972 | 1,337 | 68% |
| Minnesota Digital Library | 40,533 | 24,472 | 17,545 | 72% |
| Missouri Hub | 41,557 | 6,893 | 4,338 | 63% |
| Mountain West Digital Library | 867,538 | 227,755 | 192,501 | 85% |
| National Archives and Records Administration | 700,952 | 7,086 | 3,589 | 51% |
| North Carolina Digital Heritage Center | 260,709 | 99,258 | 84,203 | 85% |
| Smithsonian Institution | 897,196 | 348,302 | 325,878 | 94% |
| South Carolina Digital Library | 76,001 | 23,842 | 18,110 | 76% |
| The New York Public Library | 1,169,576 | 69,210 | 52,002 | 75% |
| The Portal to Texas History | 477,639 | 104,566 | 87,076 | 83% |
| United States Government Printing Office (GPO) | 148,715 | 174,067 | 105,389 | 61% |
| University of Illinois at Urbana-Champaign | 18,103 | 6,183 | 3,076 | 50% |
| University of Southern California. Libraries | 301,325 | 65,958 | 51,822 | 79% |
| University of Virginia Library | 30,188 | 3,736 | 2,425 | 65% |
Here is the breakdown when grouped by type of Hub, either Service-Hub or Content-Hub
| Hub Type | Records | Unique Subjects | Subjects unique to Hub Type | % of Subjects unique to Hub Type |
| Content Hubs | 5,736,178 | 1,311,830 | 1,253,769 | 96% |
| Service Hubs | 2,276,176 | 618,081 | 560,049 | 91% |
Or another way to look at how the subjects are shared between the different types of Hubs is the following graph.
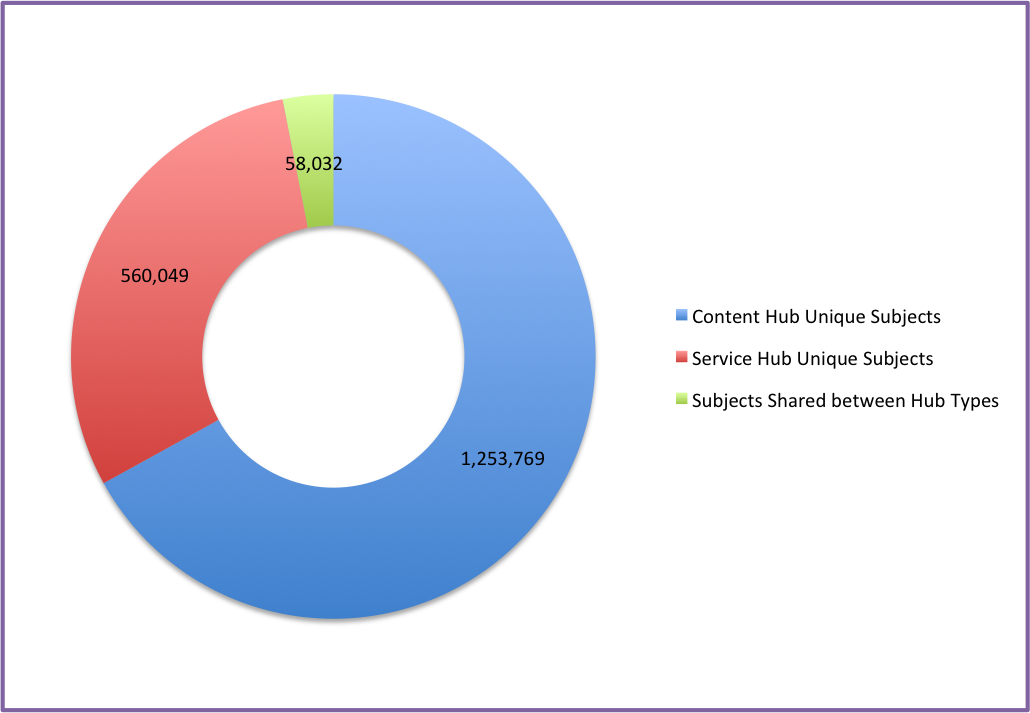
Subjects unique to and shared between Hub Types.
It appears that there is a small number (3%) of subjects that are shared between Hub types. Would increasing this number improve the ability for users to discover resources better from multiple Hubs?
More, More, More
I think once we’ve looked at the ways mentioned above I think that we should work to up the number of subjects per record within a given Hub. I don’t think there is a magic number for everyone, but at UNT we try and have three subjects for each record whenever possible. So that’s what we are shooting for. We can easily see improvement by looking at the mean and see if it goes up (even ever so slightly up)
Next Steps
I think that there is some work that we could do to identify which records need specific kinds work for subjects based on more involved processing of the input records, but I’m going to leave that for another post and probably another flight somewhere to work on.
Hope you enjoyed these three posts and hope they resonate at least a bit with you.
Feel free to send me a not on twitter if you have questions, comments, or idea for me about this.