A few weeks ago I wrote a blog post exploring the dates in the UNT Libraries’ Digital Collections. I got a few responses from that post on Twitter with one person stating that the number of Jan 1, publication dates seemed high and maybe there was something a little fishy there. After looking at the numbers a little more, I think they were absolutely right, there was something fishy going on.
First day of the month problem.
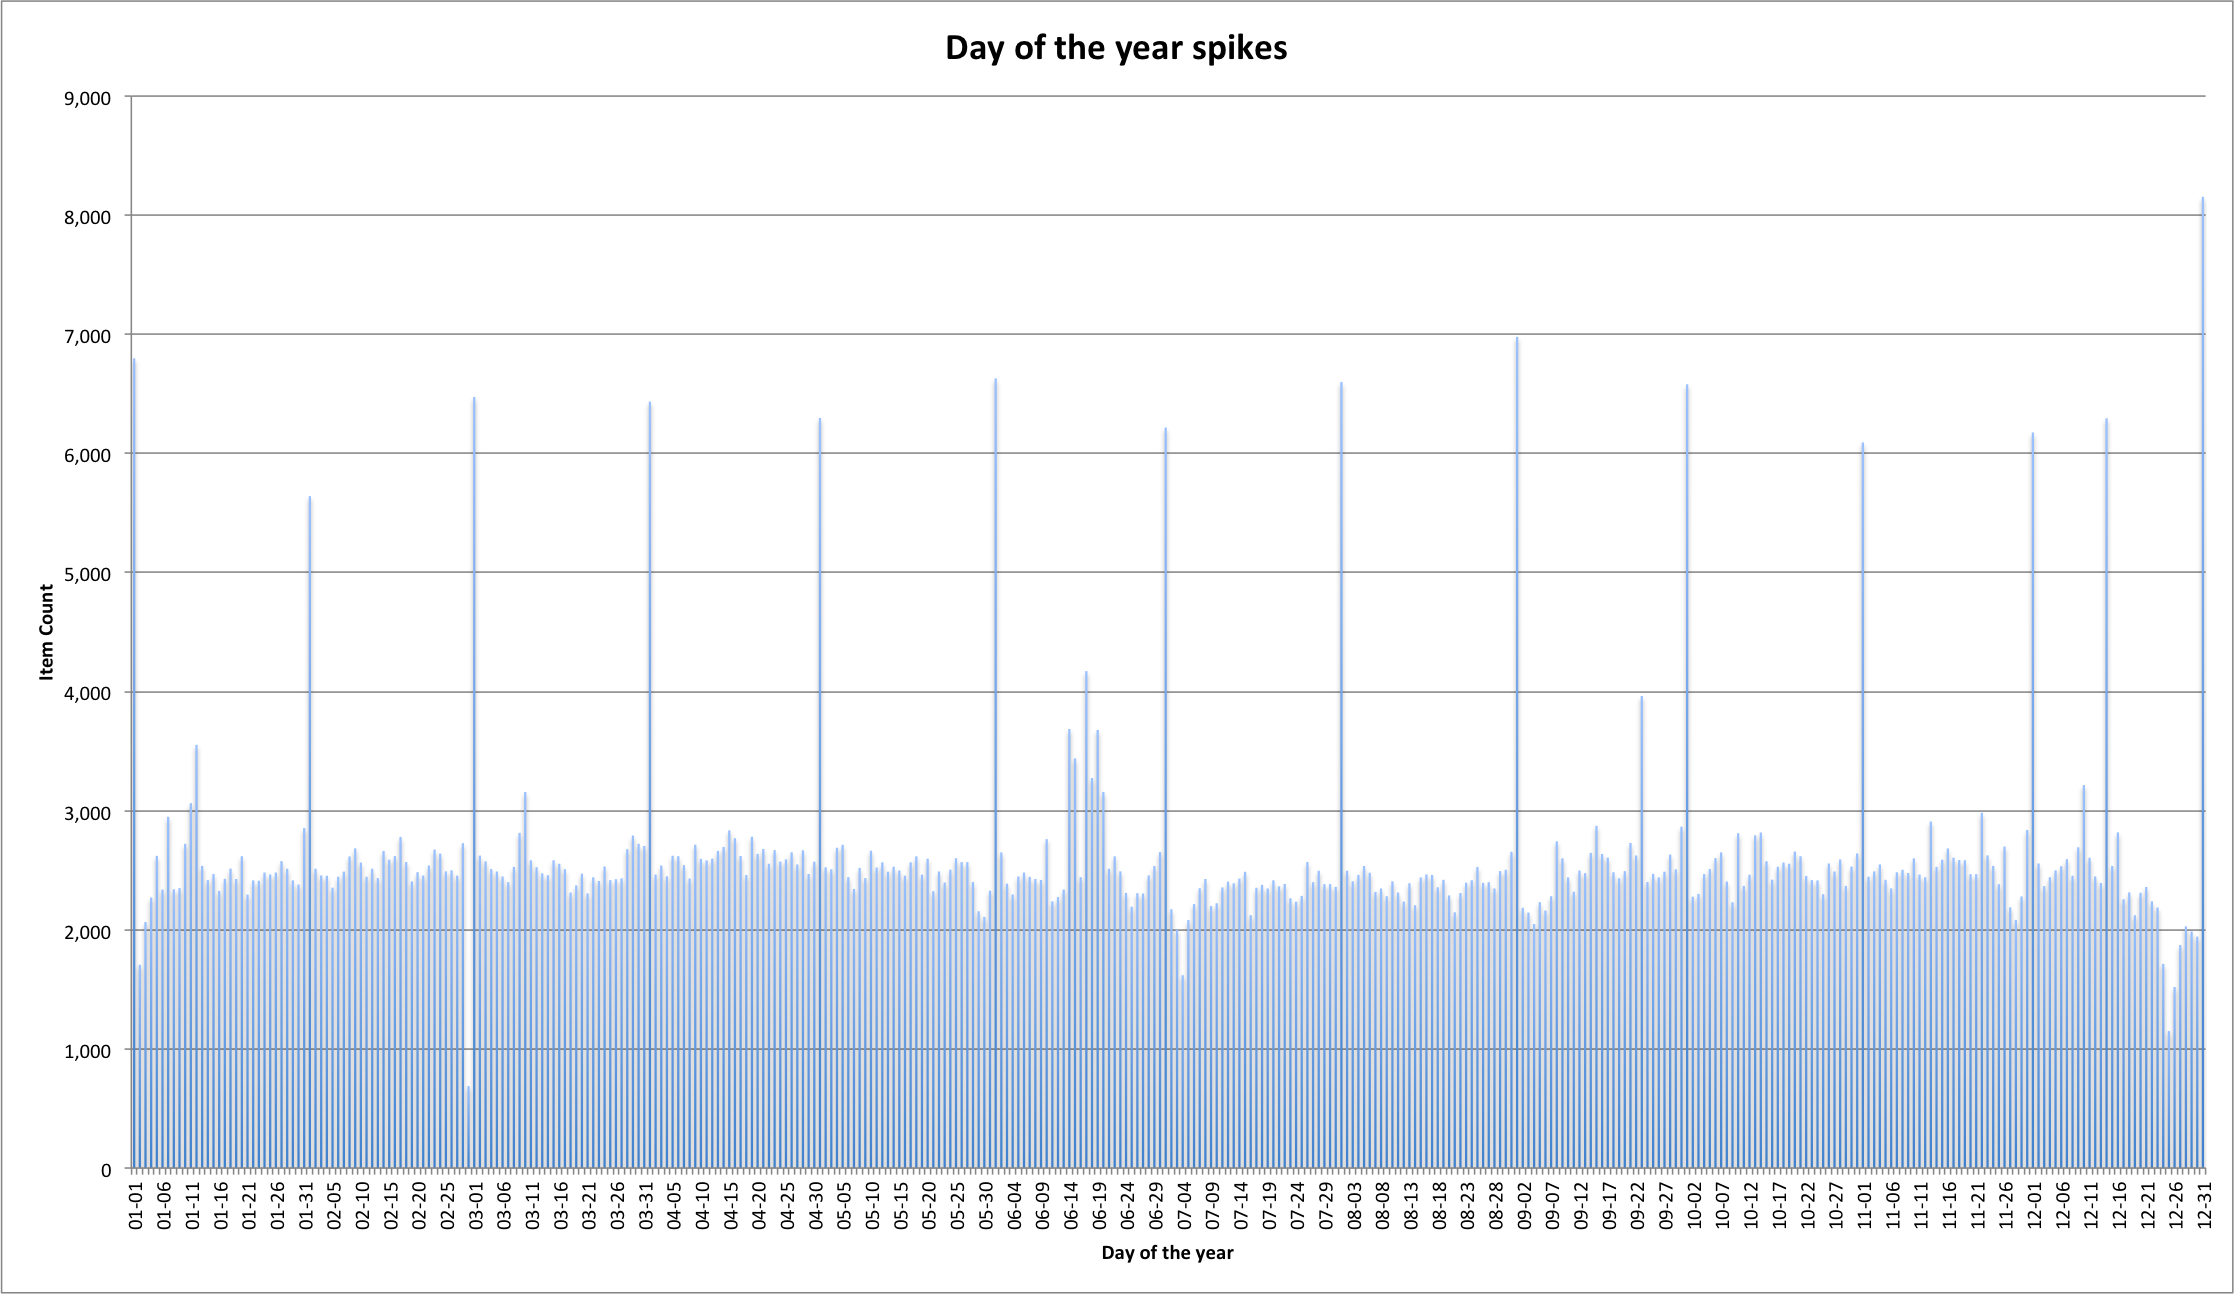
I worked up the graphic above to try and highlight what the problem is. In looking above you can see that there are very large spikes on the first day of each of the months (you may have to look really closely at that image to see the dates) and a large spike on the last day of the year, December 31.
I created this graphic by taking the 967,257 dates that in the previous post I classified as “Day” and stripped the year. I then counted the number of times a date occurred, like 01-01 for Jan 1, or 03-04 for March 4, and plotted those to the graph.
Problem Identified, Now What?
So after I looked at that graph, I got sad… so many dates that might be wrong that we would need to change. I guess part of the process of fixing metadata is to know if there is something to fix. The next thing I wanted to do was to figure out which collections had a case of the “first day of the month” and which collections didn’t have this problem.
I decided to apply my horribly limited knowledge of statistics and my highly developed skills with Google to come up with some way of identifying these collections programatically. We currently have 770 different collections in the UNT Libraries’ Digital Collections and I didn’t want to go about this by hand.
So my thought was that if I was to calculate the linear regression for a month of data I would be able to use the slope of the regression in identifying collections that might have issues. Once again I grouped all months together, so if we had a 100 year run of newspapers, all of those published on January would be together, just as April, and December. This left me with twelve slope values per collection. Some of the slopes were negative numbers and some were positive. I decided that I would take the average of the absolute values of each of these slopes to come up with my first metric.
Here are the top ten collections and their absolute slope average.
| Collection Name | Collection Code | Avg. Abs Slope |
| Office of Scientific & Technical Information Technical Reports | OSTI | 19.03 |
| Technical Report Archive and Image Library | TRAIL | 4.47 |
| National Advisory Committee for Aeronautics Collection | NACA | 4.45 |
| Oklahoma Publishing Company Photography Collection | OKPCP | 4.03 |
| Texas Digital Newspaper Program | TDNP | 2.76 |
| Defense Base Closure and Realignment Commission | BRAC | 1.25 |
| United States Census Map Collection | USCMC | 1.06 |
| Abilene Library Consortium | ABCM | 0.99 |
| Government Accountability Office Reports | GAORT | 0.95 |
| John F. Kennedy Memorial Collection | JFKAM | 0.78 |
Obviously the OSTI collection has the highest Average Absolute Slope metric at 19.03. Next comes TRAIL at 4.47 and NACA at 4.45. It should be noted that the NACA collection is a subset of the TRAIL collection so there is some influence in the numbers from NACA onto the TRAIL collection. Then we have the OKPCP collection at 4.03.
In looking at the top six collections listed in the above table, I can easily see how they could run into this “first of the month” problem. OSTI, NACA and BRAC were all created from documents harvested from federal websites. I can imagine that in situations where they were entering metadata, the tools they were using may have required a full date in the format of mm/dd/yy or yyyy-mm-dd, if the month is the only thing designated on the report you would mark it as being the first of that month so that the date would validate.
The OKPCP and TDNP collections have similar reasons as to why they would have an issue.
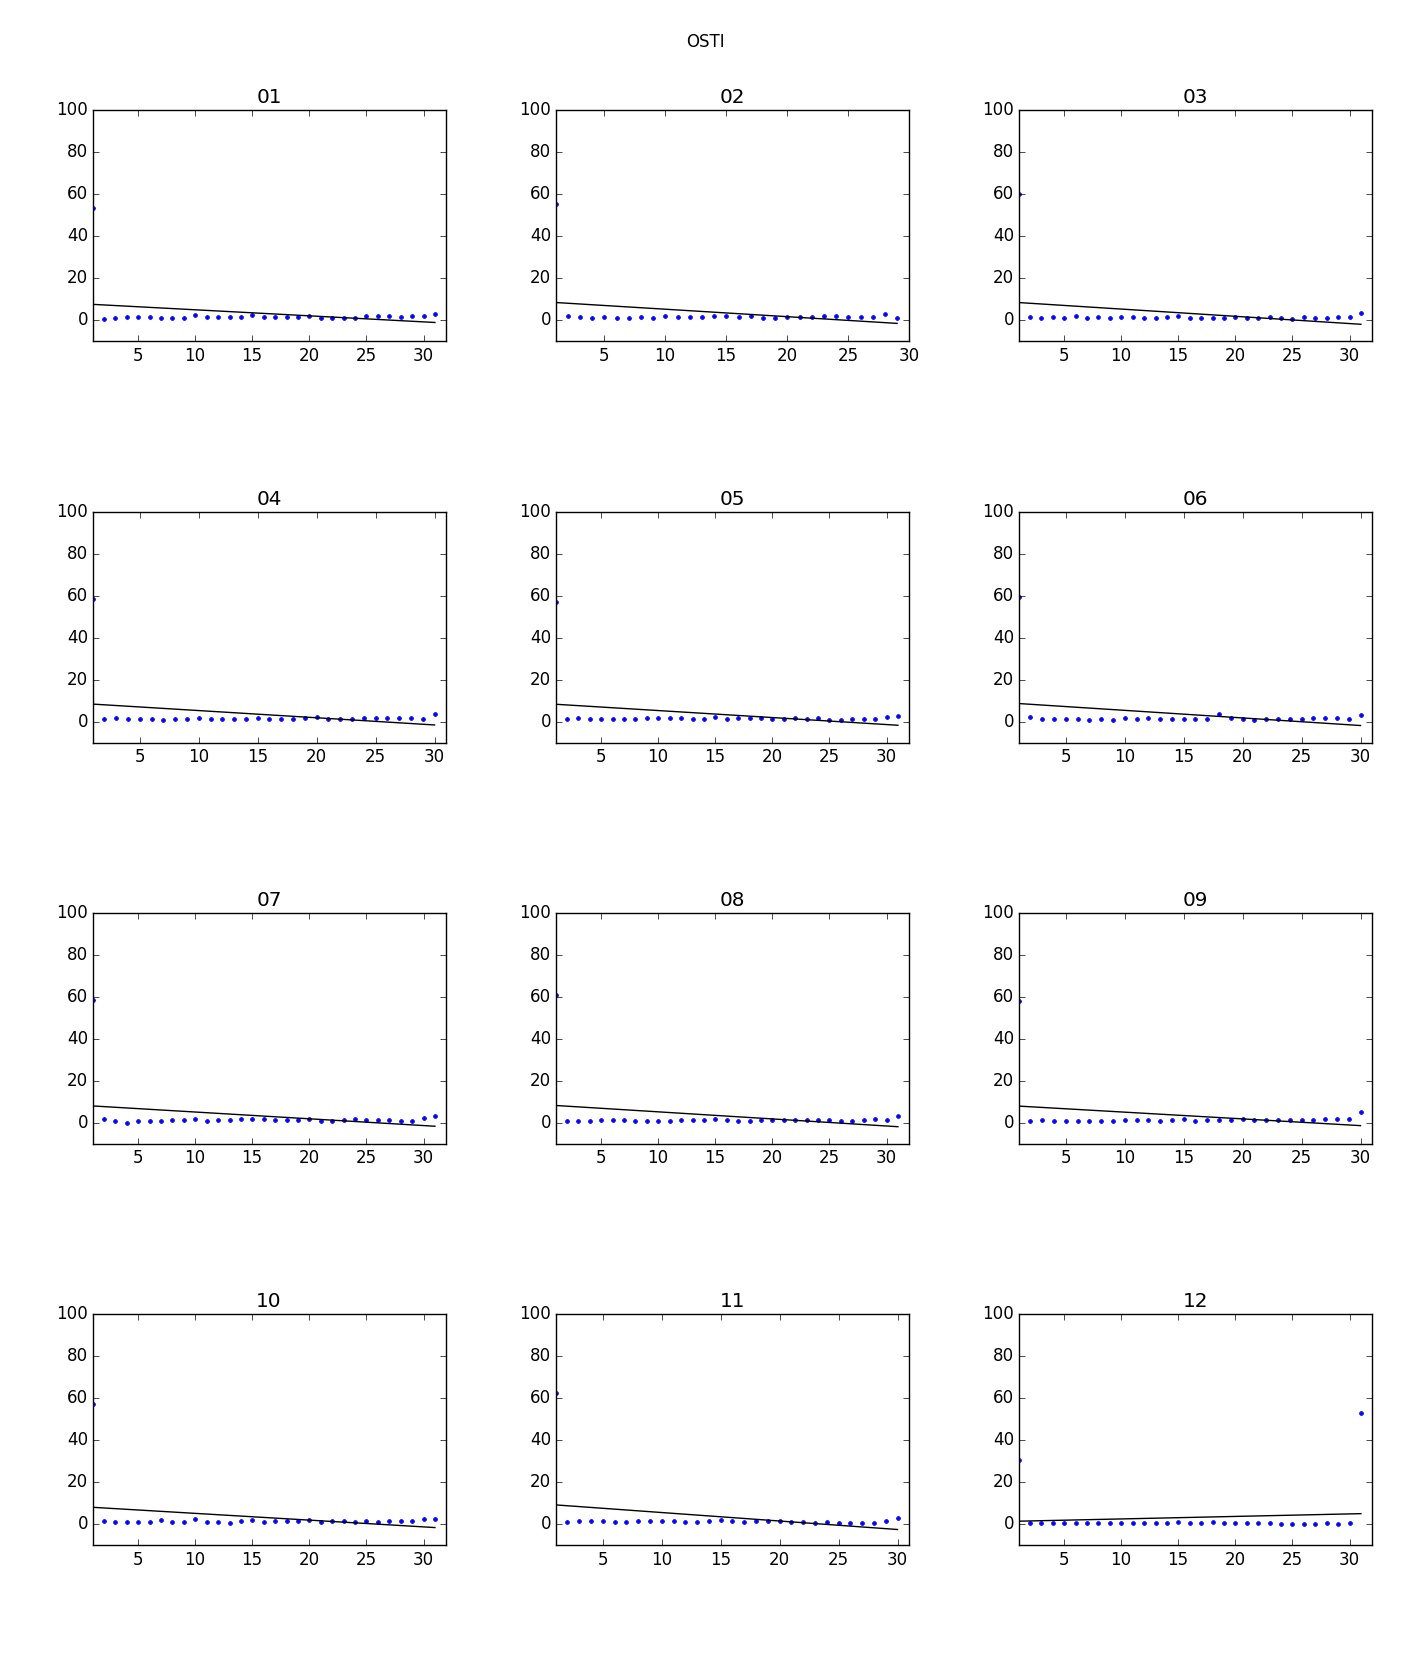
I used matplotlib to plot the monthly slopes to a graphic so that I could see what was going on. Here is a graphic for the OSTI collection.
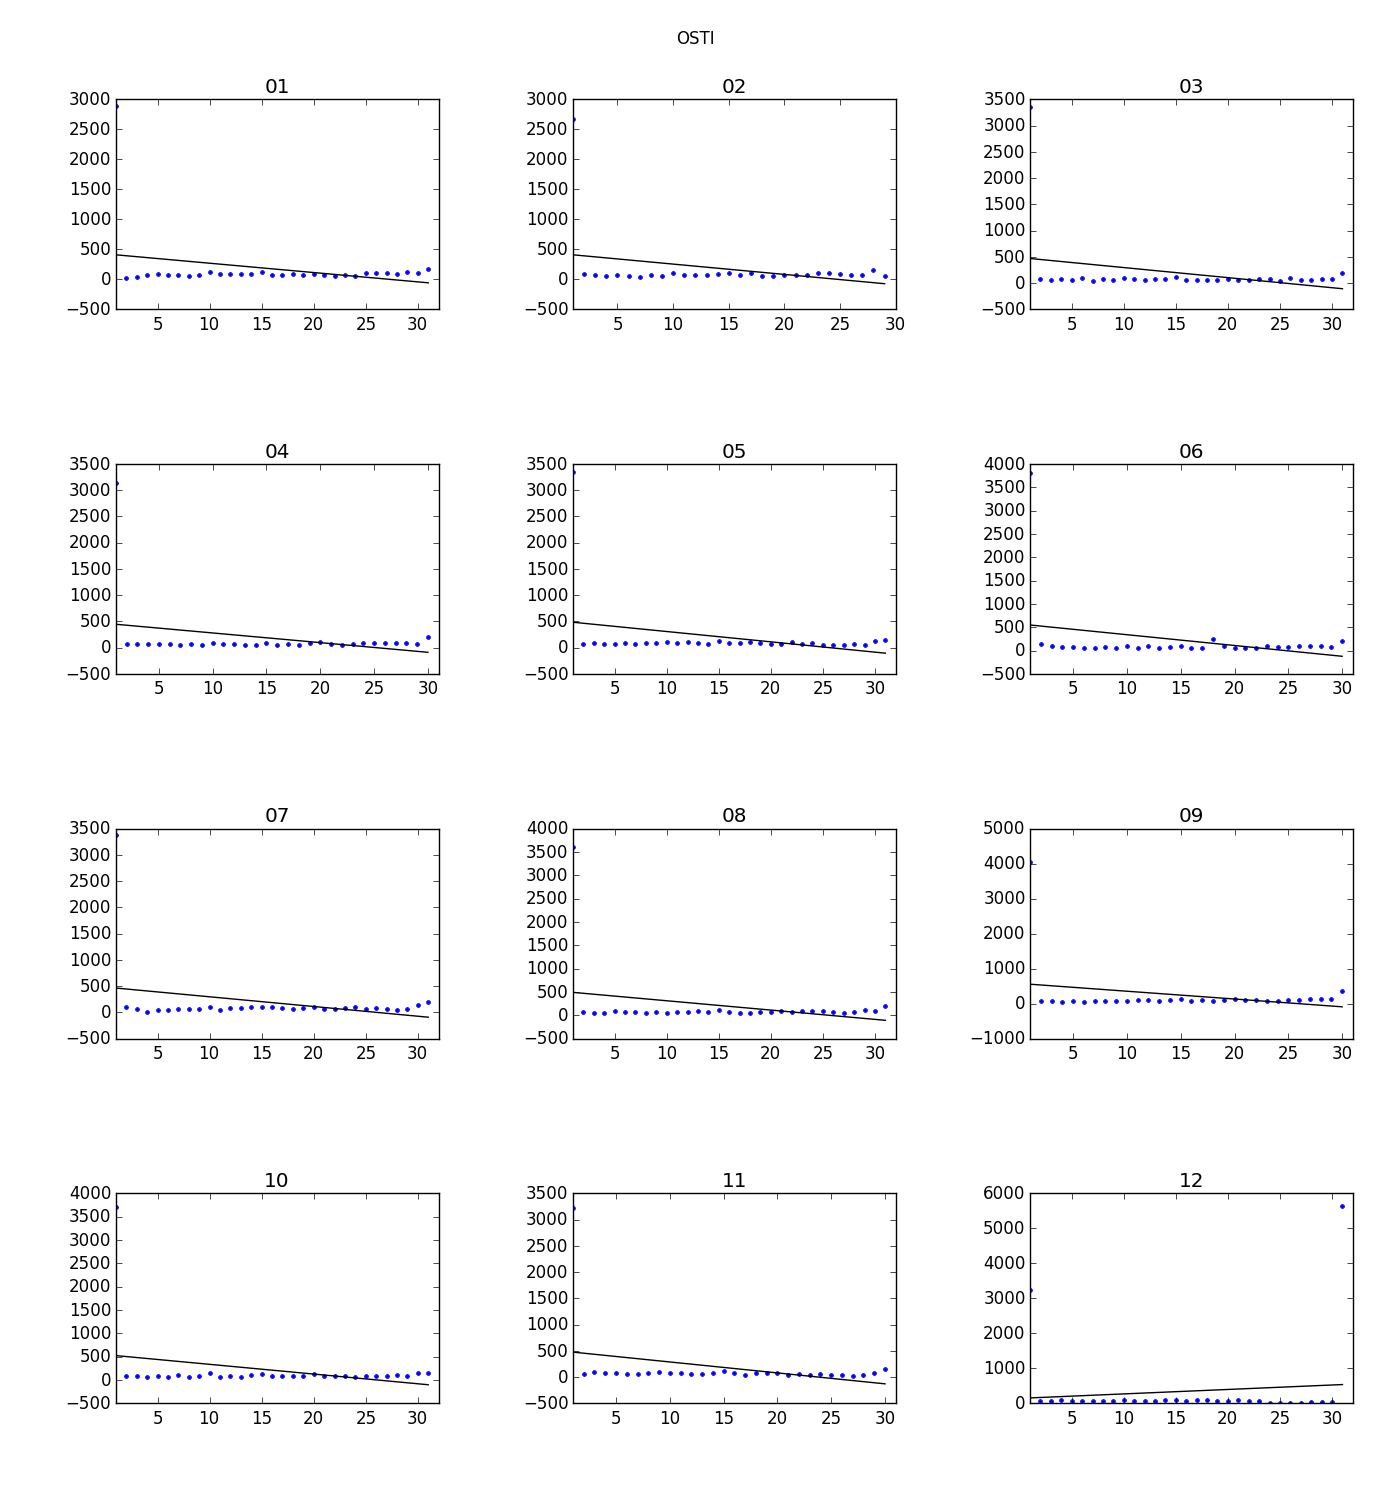
OSTI – Monthly Slopes
In contrast to the OSTI Monthly Slopes graphic above, here is a graphic of the WLTC collection that has an Average Absolute Slope of 0.000352 (much much smaller than OSTI)
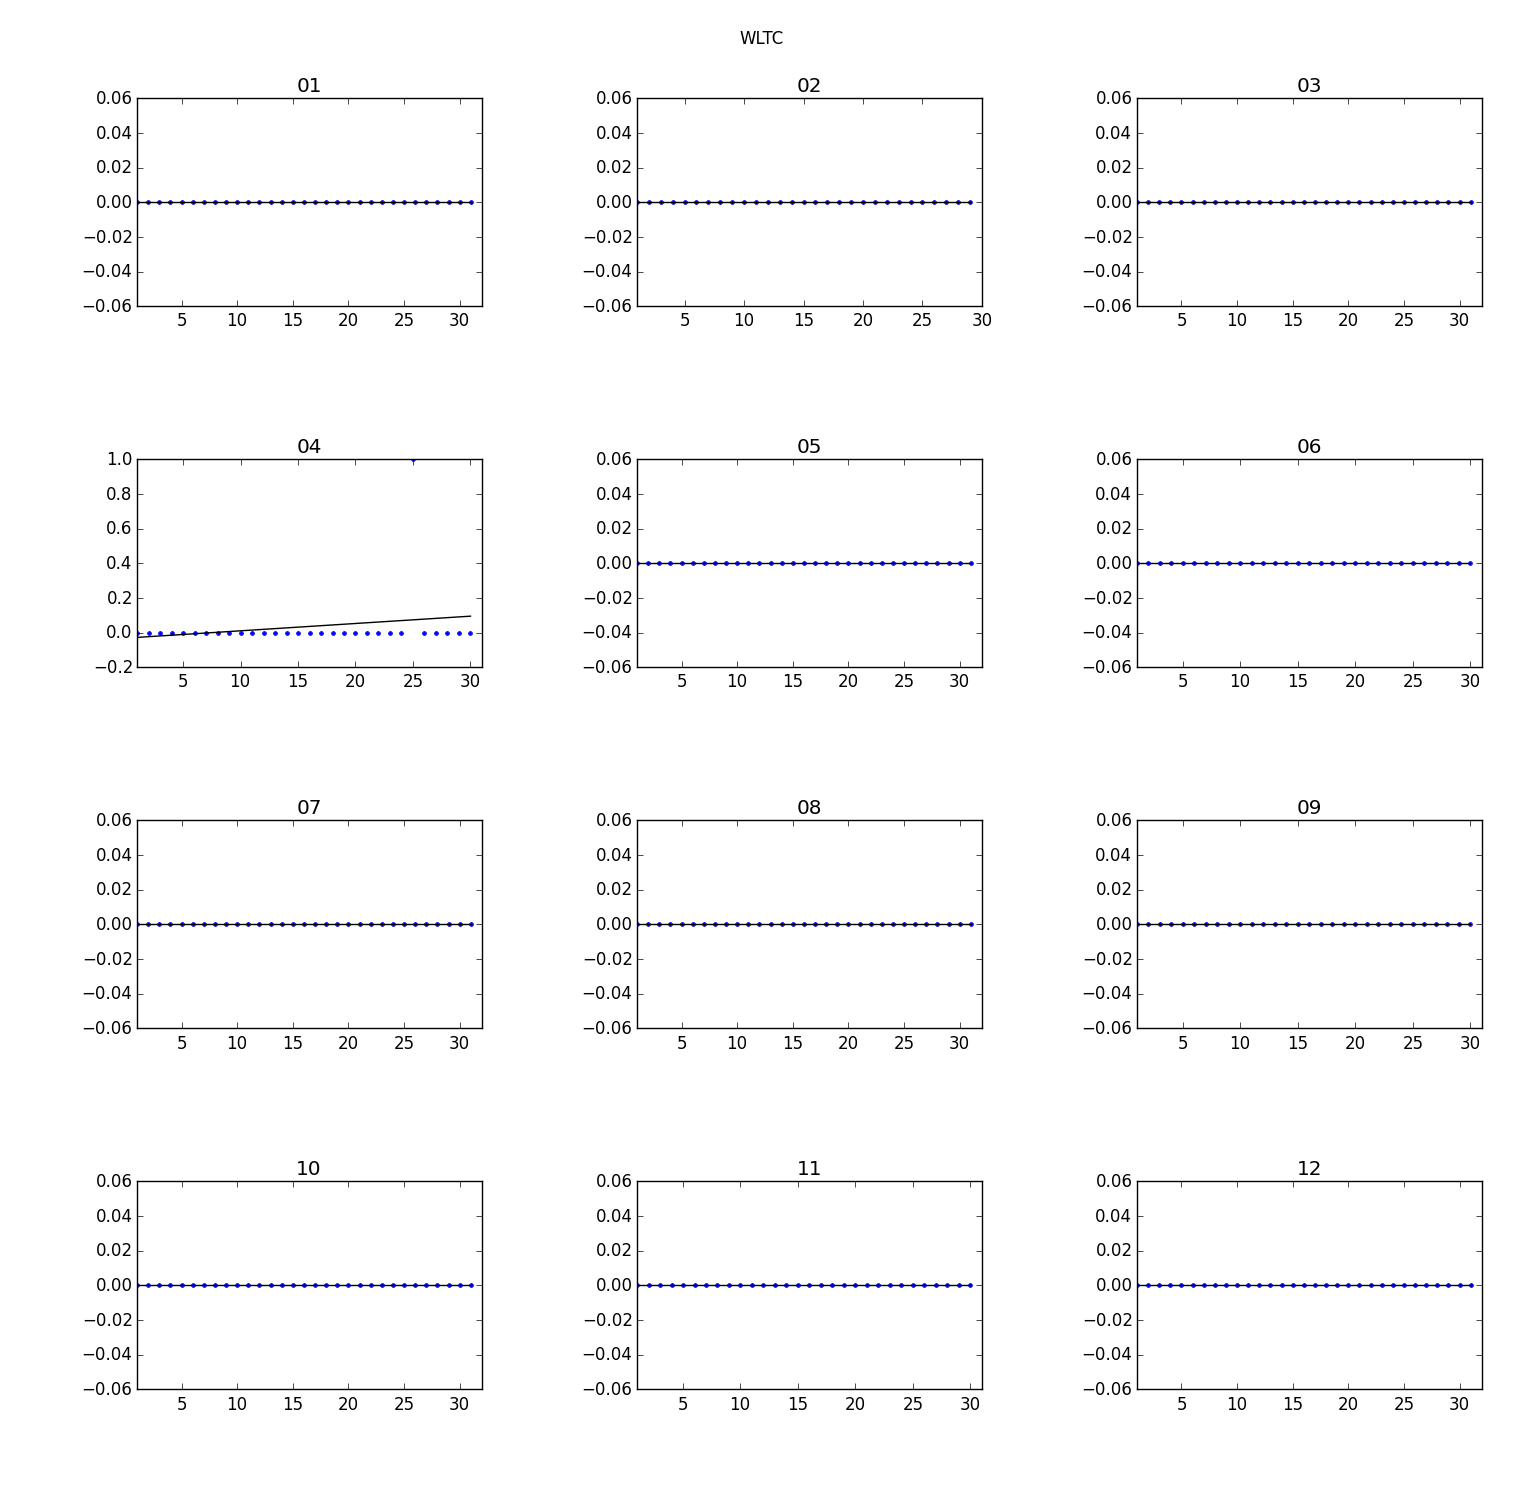
WLTC – Monthly Slopes
When looking at these you really have to pay attention to the scale of each of the subplots in order to see how much the slopes of the OSTI – Monthly Slopes are really falling or rising.
Trying something a little different.
The previous work was helpful in identifying which of the collections had the biggest “first day of the month” problems. I wasn’t too surprised with the results I got from the top ten. I wanted to normalize the numbers a bit to see if I could tease out some of the collections that had smaller numbers of items that might also have this problem but were getting overshadowed by the large OSTI collection (74,000+ items) or the TRAIL collection (18,000+ items).
I went about things in a similar fashion but this time I decided to work with the percentages for each day of a month instead of a raw count.
For the month of January for the NACA collection, here is what the difference would be for the calculations.
| Day of the Month | Item County | Percentage of Total |
| 1 | 2,249 | 82% |
| 2 | 9 | 0% |
| 3 | 3 | 0% |
| 4 | 12 | 0% |
| 5 | 9 | 0% |
| 6 | 9 | 0% |
| 7 | 19 | 1% |
| 8 | 9 | 0% |
| 9 | 18 | 1% |
| 10 | 25 | 1% |
| 11 | 14 | 1% |
| 12 | 20 | 1% |
| 13 | 18 | 1% |
| 14 | 21 | 1% |
| 15 | 18 | 1% |
| 16 | 28 | 1% |
| 17 | 21 | 1% |
| 18 | 18 | 1% |
| 19 | 19 | 1% |
| 20 | 24 | 1% |
| 21 | 24 | 1% |
| 22 | 22 | 1% |
| 23 | 8 | 0% |
| 24 | 20 | 1% |
| 25 | 18 | 1% |
| 26 | 8 | 0% |
| 27 | 10 | 0% |
| 28 | 24 | 1% |
| 29 | 15 | 1% |
| 30 | 16 | 1% |
| 31 | 9 | 0% |
Instead of the “Item County” I would use the “Percentage of Total” for the calculation of the slope and the graphics that I would generate. Hopeful that I would be able to uncover some different collections this way.
Below is the table for the top ten collections and their Average Absolute Slope based on Precent of items for a given month.
| Collection Name | Collection Name | Avg. Abs Slope of % |
| Age Index | AGE | 0.63 |
| Fraternity | FRAT | 0.63 |
| The Indian Advocate (Sacred Heart, OK) | INDIAN | 0.63 |
| Southwest Chinese Journal | SWCJ | 0.58 |
| Benson Latin American Collection | BLA | 0.39 |
| National Advisory Committee for Aeronautics Collection | NACA | 0.38 |
| Technical Report Archive and Image Library | TRAIL | 0.36 |
| Norman Dietel Photograph Collection | NDLPC | 0.34 |
| Boone Collection Bank Notes | BCBN | 0.33 |
| Office of Scientific & Technical Information Technical Reports | OSTI | 0.32 |
If you compare this to the first table in the post you will see that there are some new collections present. The first four of these are actually newspaper collections and in the case of several of them, they consist of issues that were published on a monthly basis but were notated during the digitization as being published on the first of the month because of some of the data structures that were in place for the digitization process. So we’ve identified more collections that have the “first day of the month problem”
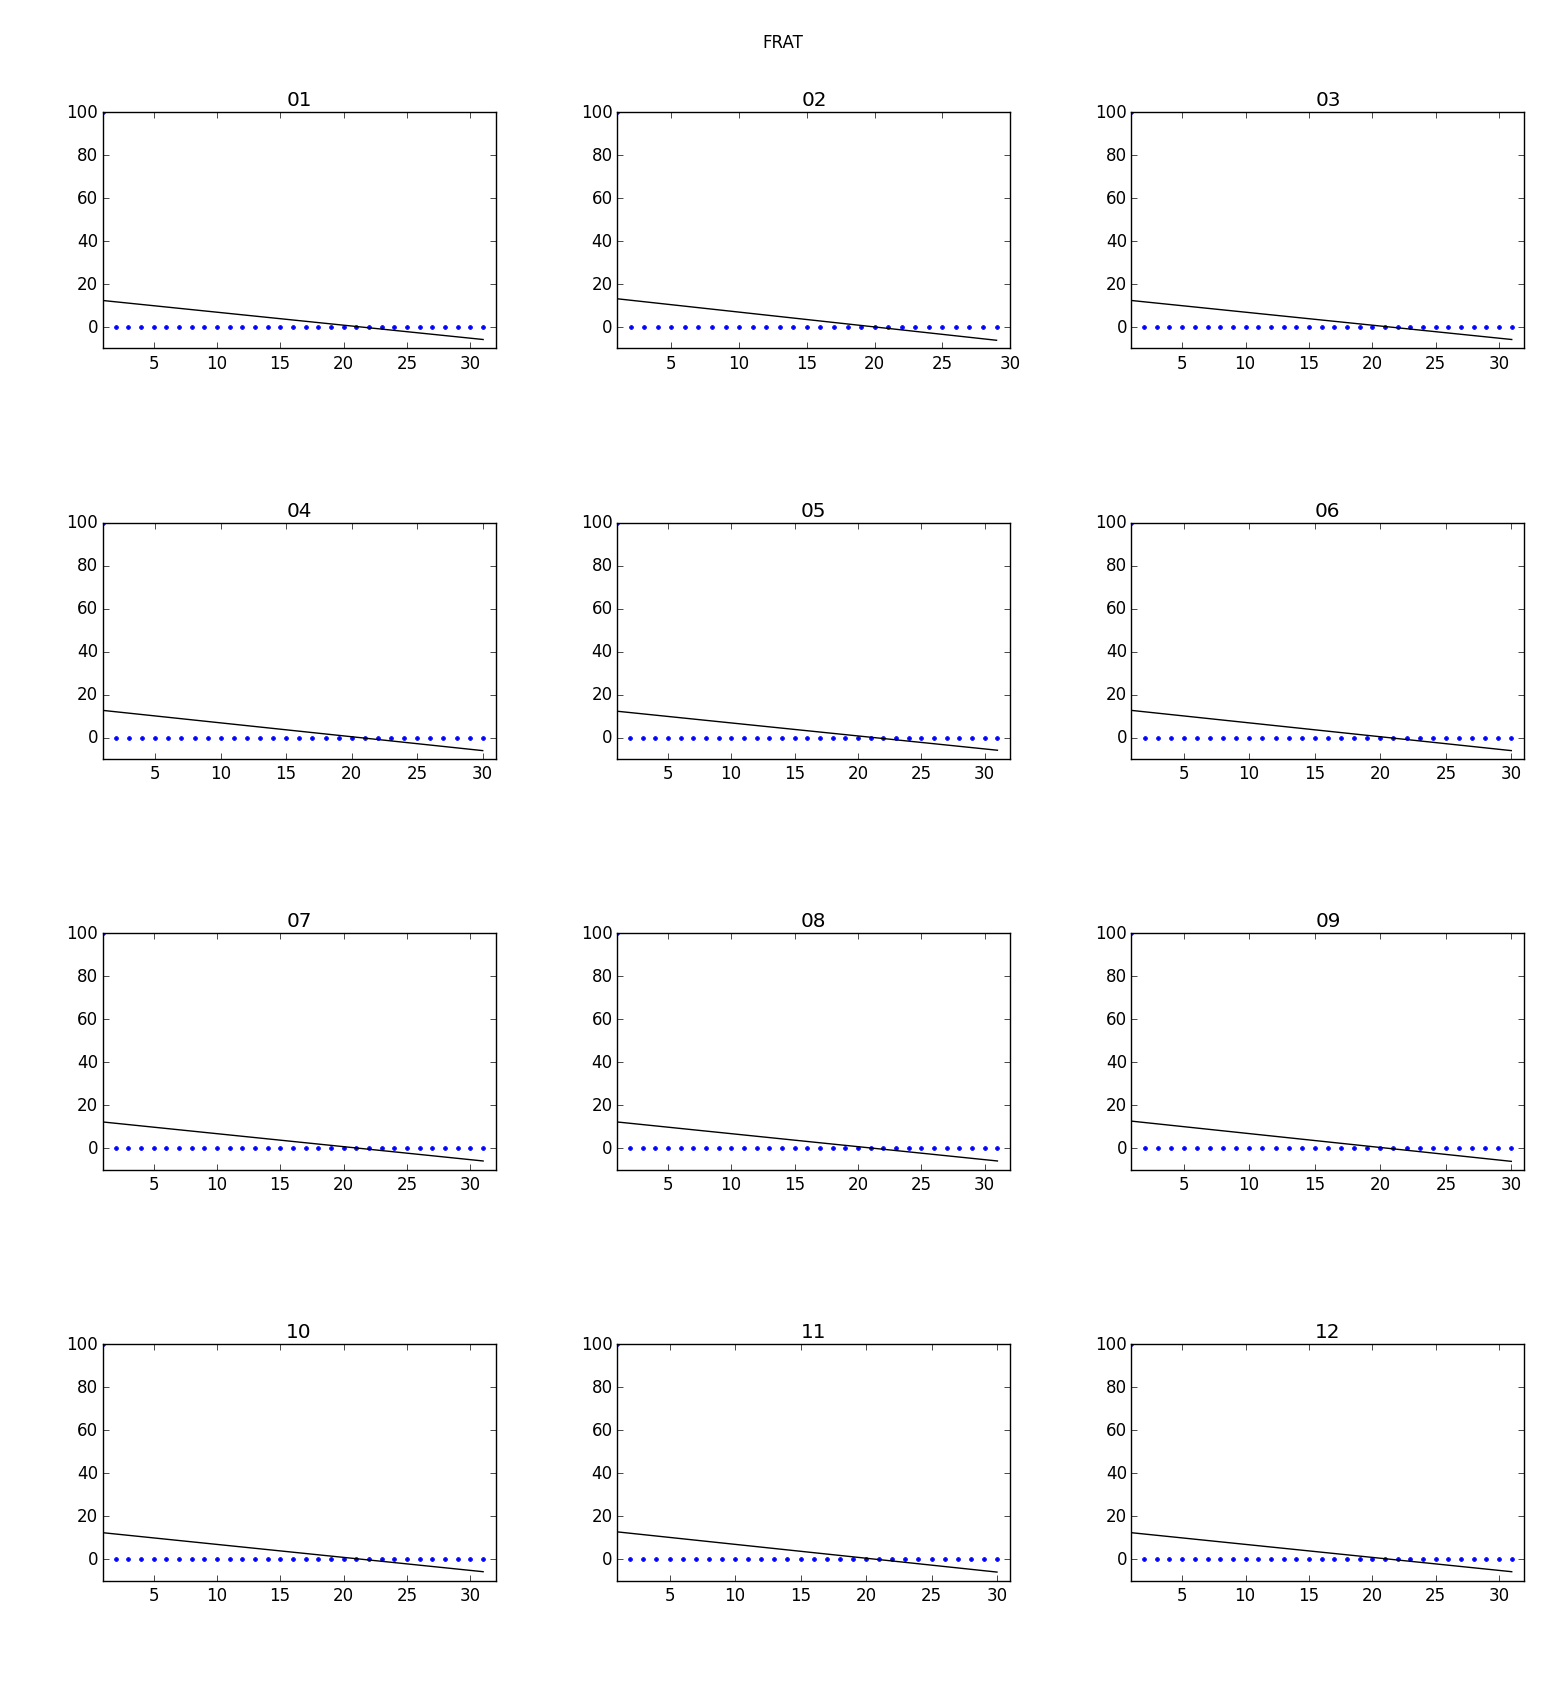
FRAT – Percentage Range
You can see that there is a consistent slope from the upper left to lower right on each of the months of the FRAT collection. For me this signifies a collection that may be suffering from the “first day of the month” problem. A nice thing about using the percentages instead of the counts directly is that we are able to find collections that are much smaller in terms of numbers, for example the FRAT has only 22 records. If we just used the counts directly these might get lost because they would have a smaller slope than that of OSTI which has many many more records.
For good measure here is the plot of the OSTI records so you can see how it differs from the count based plots.
OSTI – Percentage Range
You can see that it retained the overall shape of the slopes but it doesn’t clobber the smaller collections when you try to find collections that have issues.
Closing
I fully expect that I misused some of the math in this work or missed other obvious ways to accomplish a similar result. If a I did, do get in touch and let me know.
I think that this is a good start as a set of methods to identify collections in the UNT Libraries’ Digital Collections that suffer from the “first day of the month problem” and once identified it is just a matter of time and some effort to get these dates corrected in the metadata.
Hope you enjoyed my musings here, if you have thoughts, suggestions, or if I missed something in my thoughts, please let me know via Twitter.