Background:
At work we are deep in the process of redesigning the user interface of The Portal to Texas History. We have a great team in our User Interfaces Unit that I get to work with on this project, they do the majority of the work and I have been a data gatherer to identify problems that come up in our data.
As we are getting closer to our beta release we had a new feature we wanted to add to the collection and partner detail pages. Below is the current mockup of this detail page.
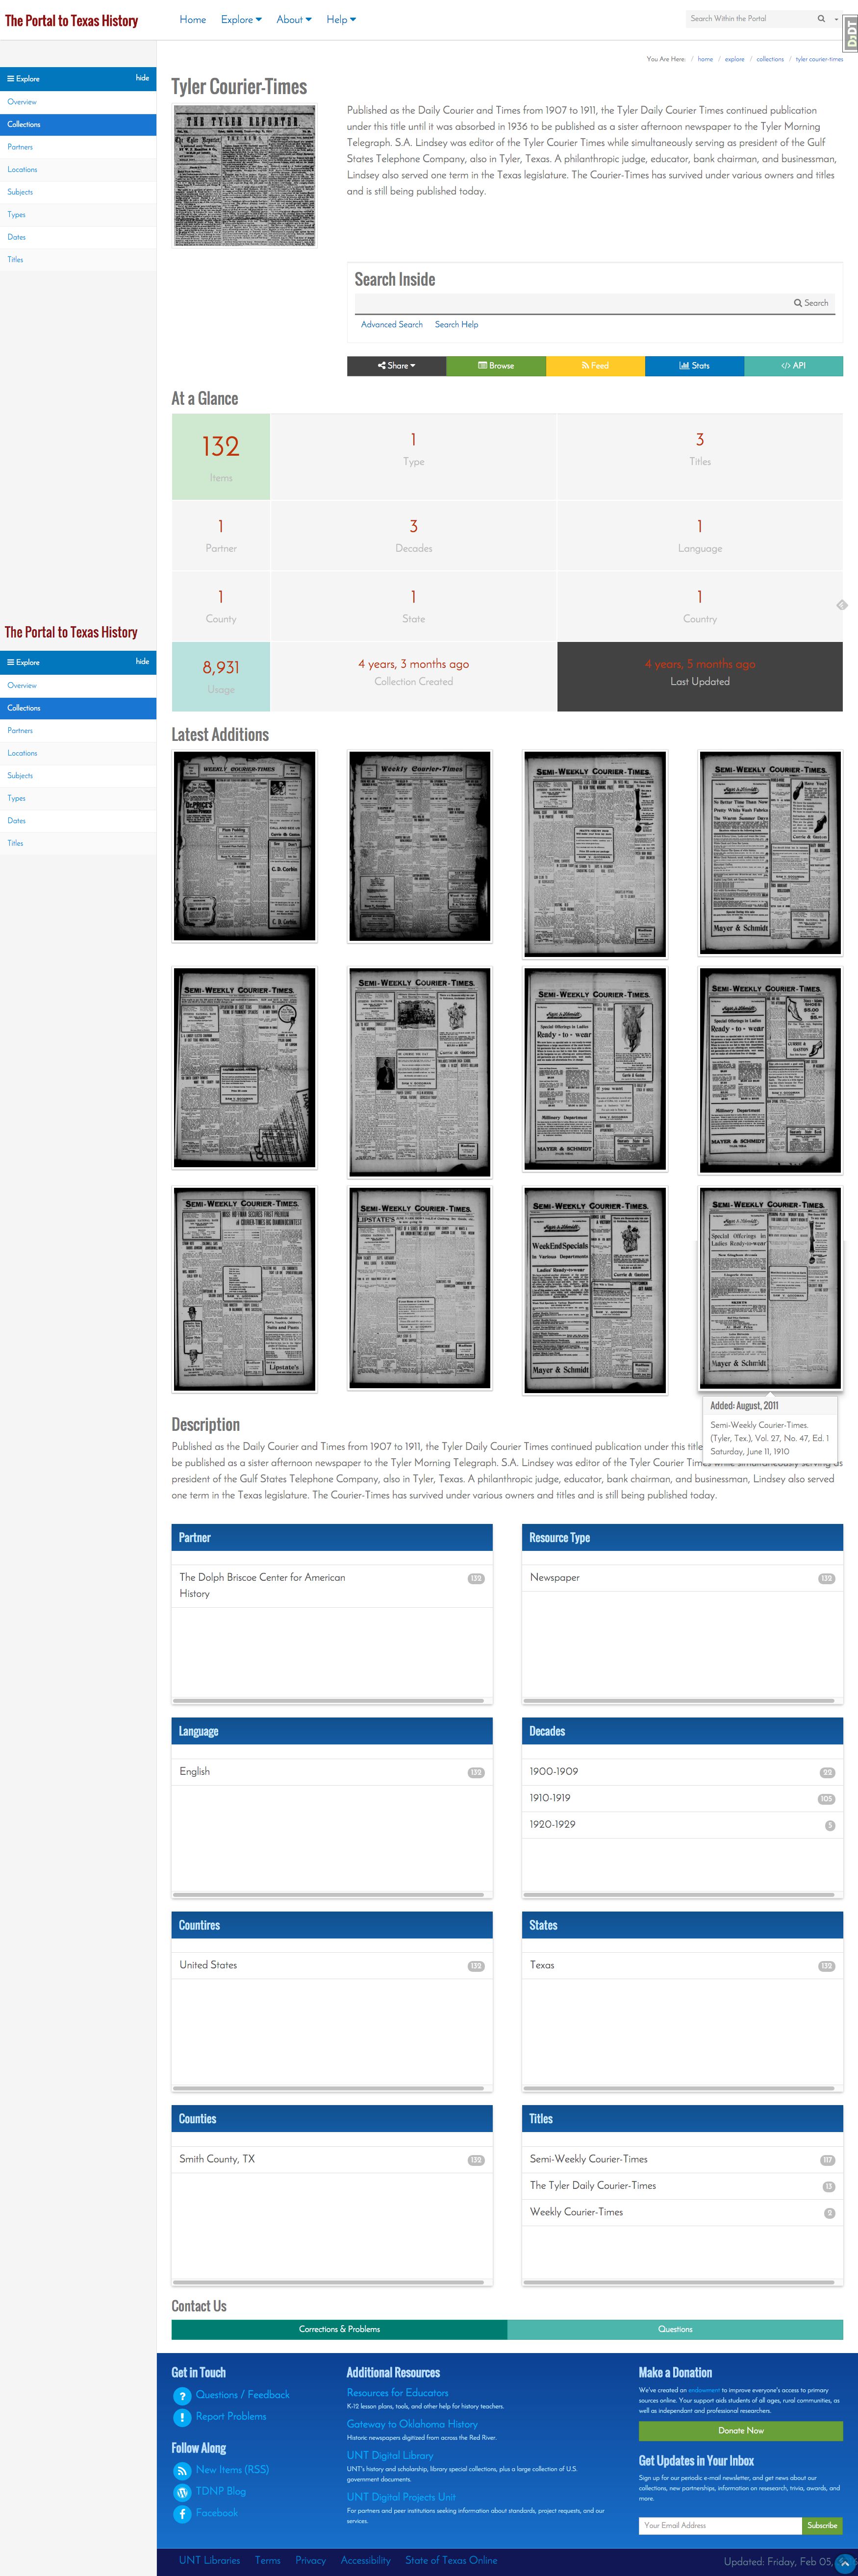
Collection Detail Mockup
Quite long isn’t it. We are trying something out (more on that later)
The feature that we are wanting more data for is the “At a Glance” feature. This feature displays the number of unique values (cardinality) of a specific field for the collection or partner.
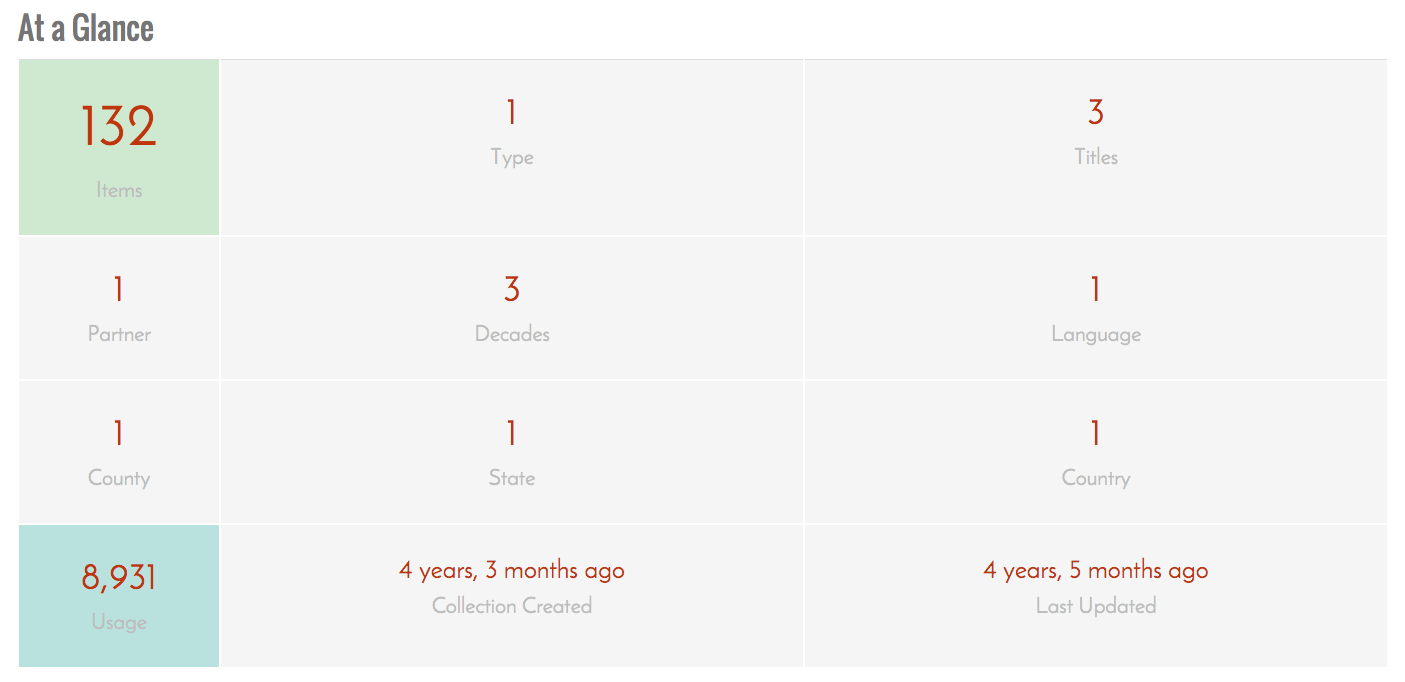
At A Glance Detail
So in the example above we show that there are 132 items, 1 type, 3 titles, 1 contributing partner, 3 decades and so on.
All this is pretty straight forward so far.
The next thing we want to do is to highlight a box in a different color if it is a value that is different from the normal. For example if the average collection has three different languages present then we might want to highlight the language box for a collection that had ten languages represented.
There are several ways that we can do this, first off we just made some guesses and coded in values that we felt would be good thresholds. I wanted to see if we could figure out a way to identify these thresholds based on the data in the collection itself. That’s what this blog post is going to try to do.
Getting the data:
First of all I need to pull out my “I couldn’t even play an extra who stands around befuddled on a show about statistics, let alone play a stats person on TV” card (wow I really tried with that one) so if you notice horribly incorrect assumptions or processes here, 1. you are probably right, and 2. please contact me so I can figure out what I’m doing wrong.
That being said here we go.
We currently have 453 unique collections in The Portal to Texas History. For each of these collections we are interested in calculating the cardinality of the following fields
- Number of items
- Number of languages
- Number of series titles
- Number of resource types
- Number of countries
- Number of counties
- Number of states
- Number of decades
- Number of partner institutions
- Number of items uses
To calculate these numbers I pulled data from our trusty Solr index making use of the stats component and the stats.calcdistinct=true option. Using this I am able to get the number of unique values for each of the fields listed above.
Now that I have the numbers from Solr I can format them into lists of the unique values and start figuring out how I want to define a threshold.
Defining a threshold:
For this first attempt I decided to try and define the threshold using the Tukey Method that uses the Interquartile Range (IQR). If you never took any statistics courses (I was a music major so not much math for me) I found this post Highlighting Outliers in your Data with the Tukey Method extremely helpful.
First off I used the handy st program to get an overview of the data that I was going to be working with.
| Field | N | min | q1 | median | q3 | max | sum | mean | stddev | stderr |
| items | 453 | 1 | 98 | 303 | 1,873 | 315,227 | 1,229,840 | 2,714.87 | 16,270.90 | 764.47 |
| language | 453 | 1 | 1 | 1 | 2 | 17 | 802 | 1.77 | 1.77 | 0.08 |
| titles | 453 | 0 | 1 | 1 | 3 | 955 | 5,082 | 11.22 | 65.12 | 3.06 |
| type | 453 | 1 | 1 | 1 | 2 | 22 | 1,152 | 2.54 | 3.77 | 0.18 |
| country | 453 | 0 | 1 | 1 | 1 | 73 | 1,047 | 2.31 | 5.59 | 0.26 |
| county | 453 | 0 | 1 | 1 | 7 | 445 | 8,901 | 19.65 | 53.98 | 2.54 |
| states | 453 | 0 | 1 | 1 | 2 | 50 | 1,902 | 4.20 | 8.43 | 0.40 |
| decade | 453 | 0 | 2 | 5 | 9 | 49 | 2,759 | 6.09 | 5.20 | 0.24 |
| partner | 453 | 1 | 1 | 1 | 1 | 103 | 1,007 | 2.22 | 7.22 | 0.34 |
| uses | 453 | 5 | 3,960 | 17,539 | 61,575 | 10,899,567 | 50,751,800 | 112,035 | 556,190 | 26,132.1 |
With the q1 and q3 values we can calculate the IQR for the field and then using the standard 1.5 multiplier or the extreme multiplier of 3 we can add this value back to the q3 value and find our upper threshold.
So for the county field
7 - 1 = 6
6 * 1.5 = 9
7 + 9 = 16
This gives us the threshold values in the table below.
| Field | Threshold – 1.5 | Threshold – 3 |
| items | 4,536 | 7,198 |
| language | 4 | 5 |
| titles | 6 | 9 |
| type | 4 | 5 |
| country | 1 | 1 |
| county | 16 | 25 |
| states | 4 | 5 |
| decade | 20 | 30 |
| partner | 1 | 1 |
| uses | 147,997 | 234,420 |
Moving forward we can use these thresholds as a way of saying “this field stands out in this collection from other collections” and make the box in the “At a Glance” feature a different color.
If you have questions or comments about this post, please let me know via Twitter.