One of the things that we were excited about when we adding the Clustering Dashboard to the UNT Libraries’ Edit system was the ability to experiment with new algorithms for grouping or clustering metadata values. I gave a rundown of the Cluster Dashboard in a previous blog post
This post is going to walk through some of things that we’ve been doing to try and bring new data views to the metadata we are managing here at the UNT Libraries.
The need to sample
I’m going to talk a bit about the need to sample values first and then get to the algorithms that make use of it in a bit.
When we first developed the Cluster Dashboard we were working with a process that would take all of the values of a selected metadata element, convert those values into a hash value of some sort and then and identify where there were more than one value that produces the same hash. We were only interested in the instances that contained multiple values that had the same hash. While there were a large number of clusters for some of the elements, each cluster had a small number of values. I think the biggest cluster I’ve seen in the system had 14 values. This is easy to display to the user in the dashboard so that’s what we did.
Moving forward we wanted to make use of some algorithms that would result in hundreds, thousands, and even tens of thousands of values per cluster. An example of this is trying to cluster on the length of a field. In our dataset there are 41,016 different creator values that are twelve characters in length. If we tried to display all of that to the user we would quickly blow up the browser for the user which is never any fun.
What we have found is that there are some algorithms we want to use that will always return all of the values and not only when there are multiple values that share a common hash. For these situations we want to be proactive and sample the cluster members so that we don’t overwhelm the users interface.
Sampling Options in Cluster Dashboard
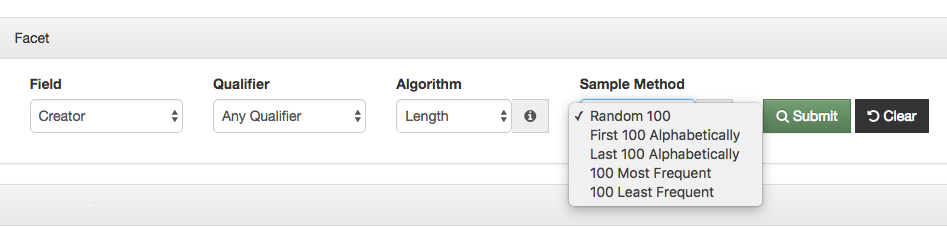
You can see in the screenshot above that there are a few different ways that you can sample the values of a cluster.
- Random 100
- First 100 Alphabetically
- Last 100 Alphabetically
- 100 Most Frequent
- 100 Least Frequent
This sampling allows us to provide some new types of algorithms but still keep the system pretty responsive. So far we’ve found this works because when you are using these cluster algorithms that return so many value you generally aren’t interested in the clusters that are the giant clusters. You are typically looking for anomalies that show up in smaller clusters, like really long or really short values for a field.

Cluster Options in Dashboard showing sampled and non-sampled clustering algorithms.
We divided the algorithm selection dropdown into two parts to try and show the user the algorithms that will be sampled and the ones that don’t require sampling. The option to select a sample method will only show up when it is required by the algorithm selected.
New Algorithms
As I mentioned briefly above we’ve added a new set of algorithms to the Cluster Dashboard. These algorithms have been implemented to find anomalies in the data that are a bit hard to find other ways. First on the list is the Length algorithm. This algorithm uses the number of characters or length of the value as the clustering key. Generally the very short and the very long values are the ones that we are interested in.
I’ll show some screenshots of what this reveals about our Subject element. I always feel like I should make some sort of defense of our metadata when I show these screenshots but I have a feeling that anyone actually reading this will know that metadata is messy.
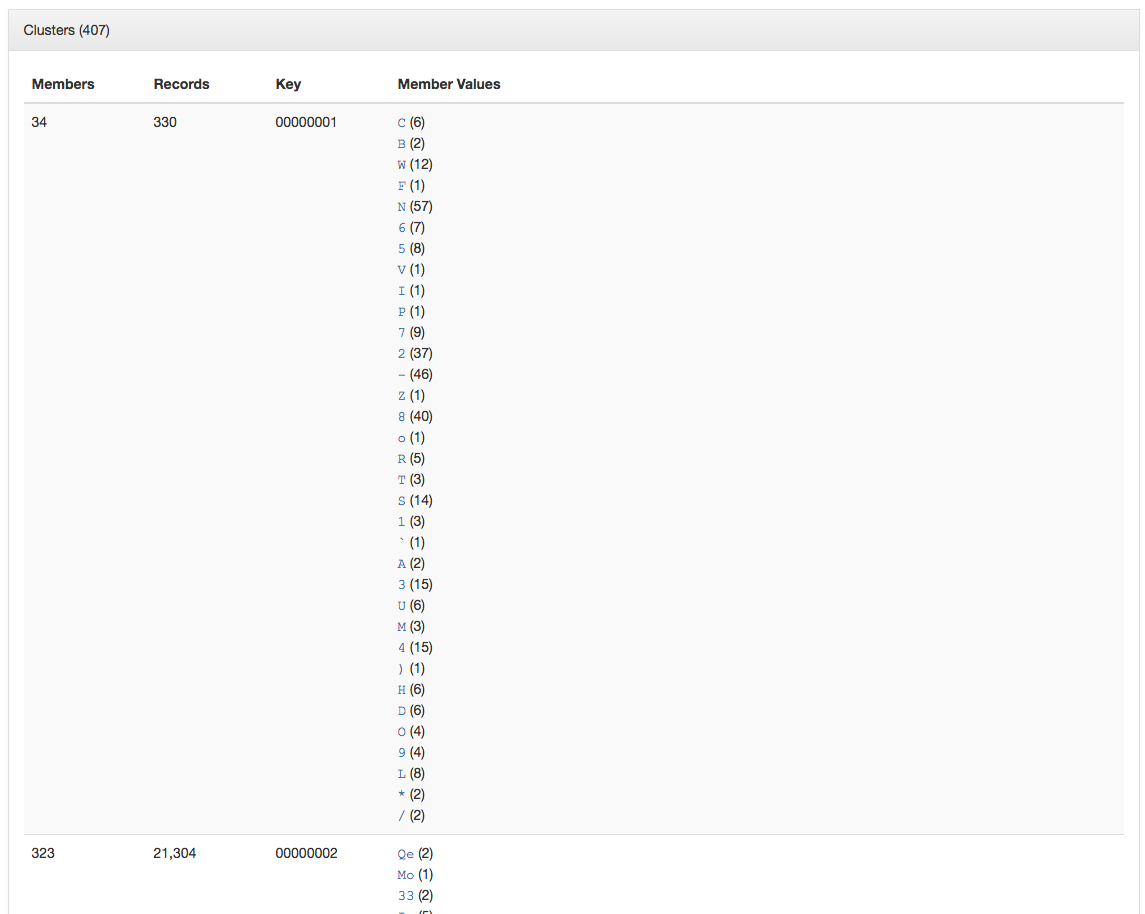
Subject Clustered by Length (shortest)
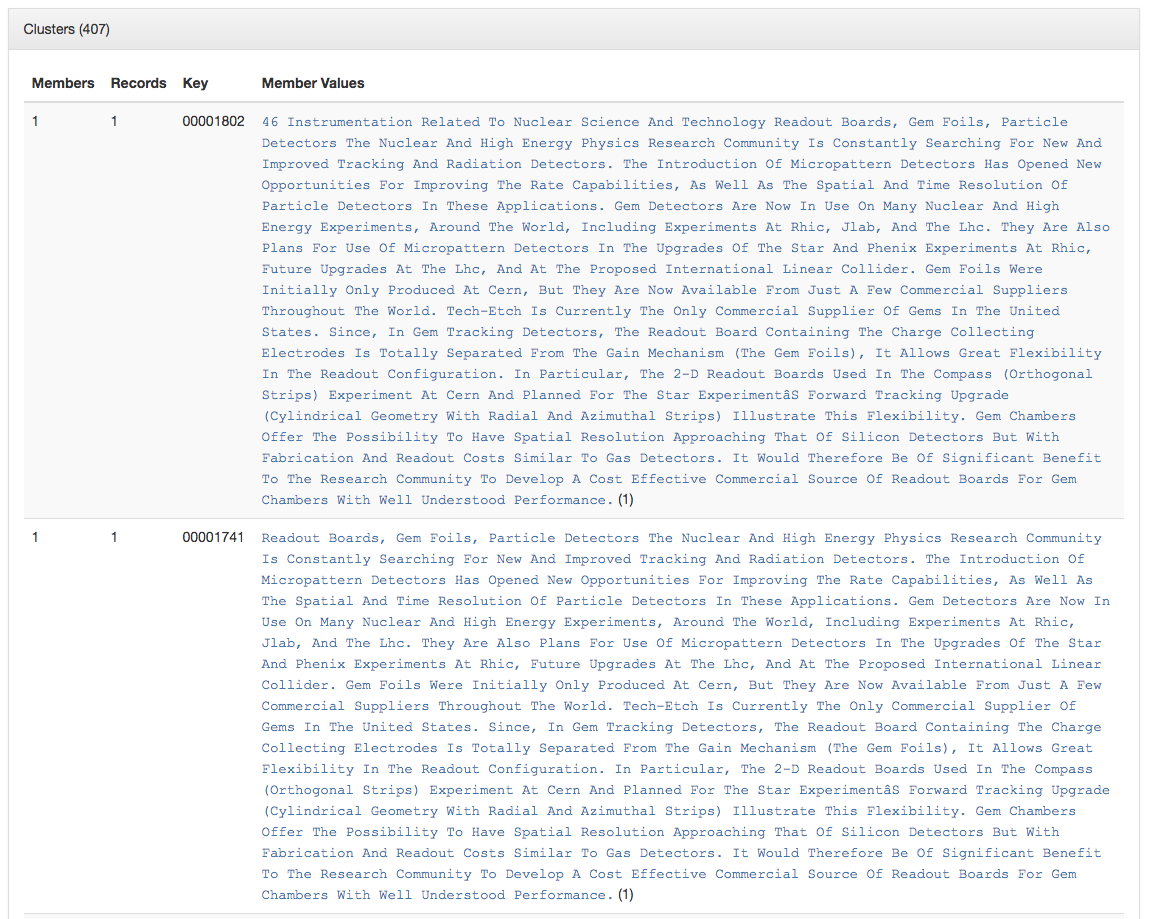
Subject Clustered by Length (longest)
So quickly we can get to values that we probably want to change. In this case the subject values that are only one character in length or those that are over 1,600 characters in length.
A quick story about how this is useful. We had a metadata creator a few years back accidentally pasted the contents of a personal email into the title field of a photograph because they just got their clipboard mixed up. They didn’t notice this so it went unnoticed for a few weeks until it was stumbled on by another metadata editor. This sort of thing happens from time to time and can show up with this kind of view.
There are a few variations on the length that we provide. Instead of the number of characters we have another view that is the count of tokens in the metadata value. So a value of “University of North Texas” would have a token count of 4. This gives a similar but different view as the length.
Beyond that we provide some algorithms that look at the length of tokens within the values. So the value of “University of North Texas” would have an Average Token Length of 5.5. I’ve honestly not found a good use for the Average Token Length, Median Token Length, Token Length Mode, or Token Length Range yet but maybe we will?
Finally there is the Pattern Mask algorithm that was implemented primarily for the date field in our metadata records. This algorithm takes in the selected metadata element values and converts all digits to 0 and all of the letters to an a. It leaves all punctuation characters alone.
So a value of “1943” maps to “0000” or a value of “July 4, 2014” maps to “aaaa 0, 0000”.
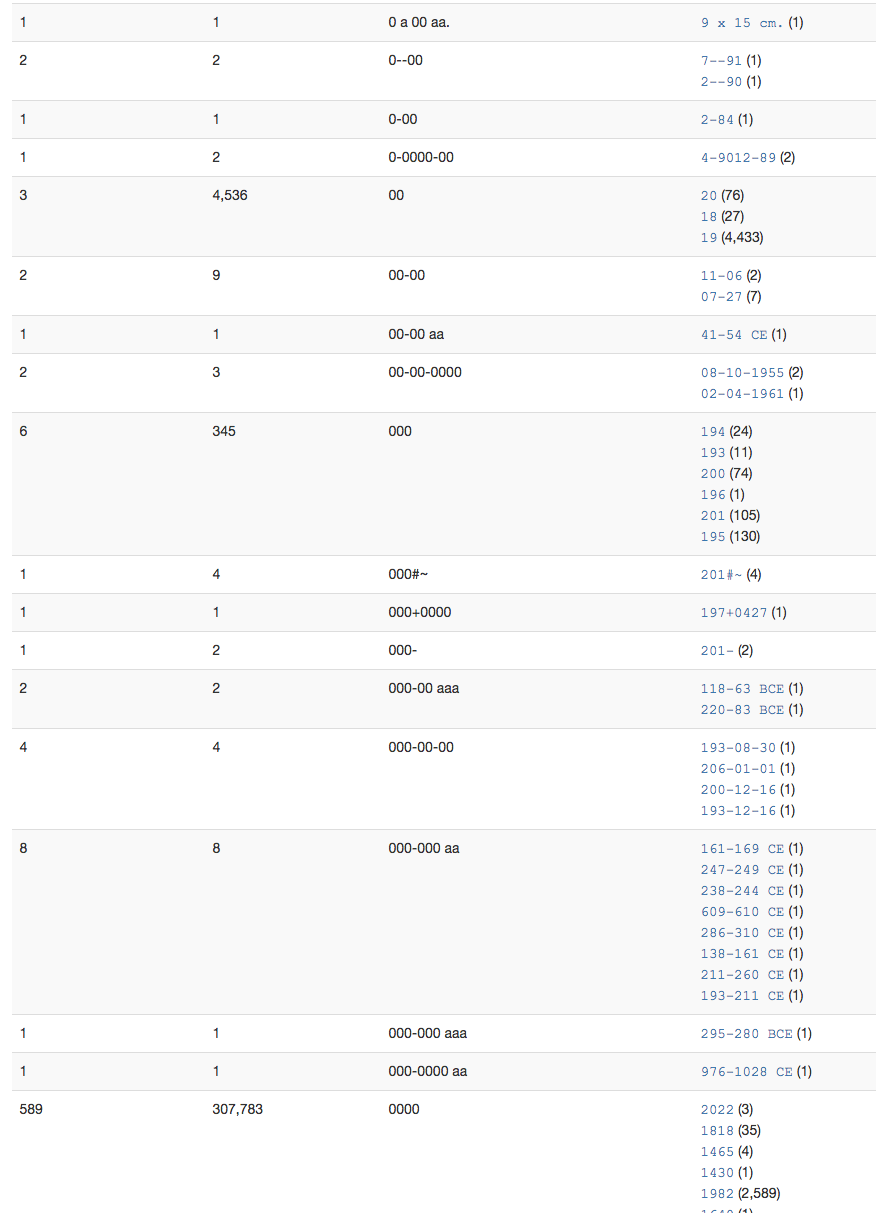
Pattern Mask on Date Element
In the example above you can quickly see the patterns that we will want to address as we continue to clean up our date element.
As I mentioned at the beginning of the post, one of the things that we were excited about when we implemented the Cluster Dashboard was the ability to try out different algorithms for looking at our metadata. This is our first set of “new” algorithms for the system. We also had to add the ability to sample the clusters because the can quickly get crazy with the number of values. Hopefully we will be able to add additional clustering algorithms to the system in the future.
Are there any ideas that you have for us that you would like us to try out in the interface? If so please let me know, we would love to experiment a bit.
If you have questions or comments about this post, please let me know via Twitter.