This is a continuation of a series of posts that I never got around to writing earlier this semester. I posted the first and second post in the series in February but never got around to writing the rest of them. This time I am looking at if users use items from multiple collections in the UNT Digital Library.
The dataset I am using is a subset of the 10,427,111 user sessions logged in the UNT Libraries Digital Collections in 2017. This subset is specifically for the UNT Scholarly Works Repository. There are a total of 253,369 sessions in this dataset and these have been processed in the same way as was mentioned in previous posts.
Of these 253,369 sessions, there were 223,168 that were sessions that involved interactions with a single item. This means 88% of the time when a user made use of an object in the UNT Scholarly Works Repository, it was for just one item. This leaves us 30,201 of the sessions in 2017 that would be interesting to look at for our further analysis.
| Items Accessed | Sessions | Percentages of All Sessions |
| 1 | 223,168 | 88.08% |
| 2 | 17,627 | 6.96% |
| 3 | 5,009 | 1.98% |
| 4 | 2,267 | 0.89% |
| 5 | 1,285 | 0.51% |
| 6 | 824 | 0.33% |
| 7 | 598 | 0.24% |
| 8 | 404 | 0.16% |
| 9 | 270 | 0.11% |
| 10 | 204 | 0.08% |
| 11 | 150 | 0.06% |
| 12 | 96 | 0.04% |
| 13 | 94 | 0.04% |
| 14 | 63 | 0.02% |
| 15 | 41 | 0.02% |
| 16 | 42 | 0.02% |
| 17 | 50 | 0.02% |
| 18 | 45 | 0.02% |
| 19 | 50 | 0.02% |
| 20 | 264 | 0.10% |
| 30 | 147 | 0.06% |
| 40 | 135 | 0.05% |
| 50 | 117 | 0.05% |
| 60 | 43 | 0.02% |
| 70 | 39 | 0.02% |
| 80 | 40 | 0.02% |
| 90 | 33 | 0.01% |
| 100 | 123 | 0.05% |
| 200 | 52 | 0.02% |
| 300 | 33 | 0.01% |
| 400 | 19 | 0.01% |
| 500 | 6 | 0.00% |
| 600 | 8 | 0.00% |
| 700 | 6 | 0.00% |
| 800 | 6 | 0.00% |
| 900 | 2 | 0.00% |
| 1000 | 9 | 0.00% |
Based on what I see in this table I’m choosing 11 item uses as the cutoff point for further analysis. This means that I will be looking at all of the sessions that have 2 – 11 items per session. This is 11% of the 253,369 UNT Scholarly Works sessions and 95% of the sessions that have more than one item used. This represents 28,638 user sessions we are analyzing in the rest of this post..
Looking at the Sessions
With the dataset layout we have we can easily go through and look at the Partners, Resource Types, and finally the Collections used per session. Let’s get started.
The first category we will look at are the Partners present in the sessions. In the UNT Scholarly Works collection there is generally a single Partner field for a record. This Partner is usually the contributing college, department, or center on campus where the author of the resource is contributing from. The model is flat and doesn’t allow for any nuance for multiple authors from different colleges but seems to work pretty well for many of the items in the repository. As I said there is generally a one-to-one relationship between an object and a Partner field in the dataset.
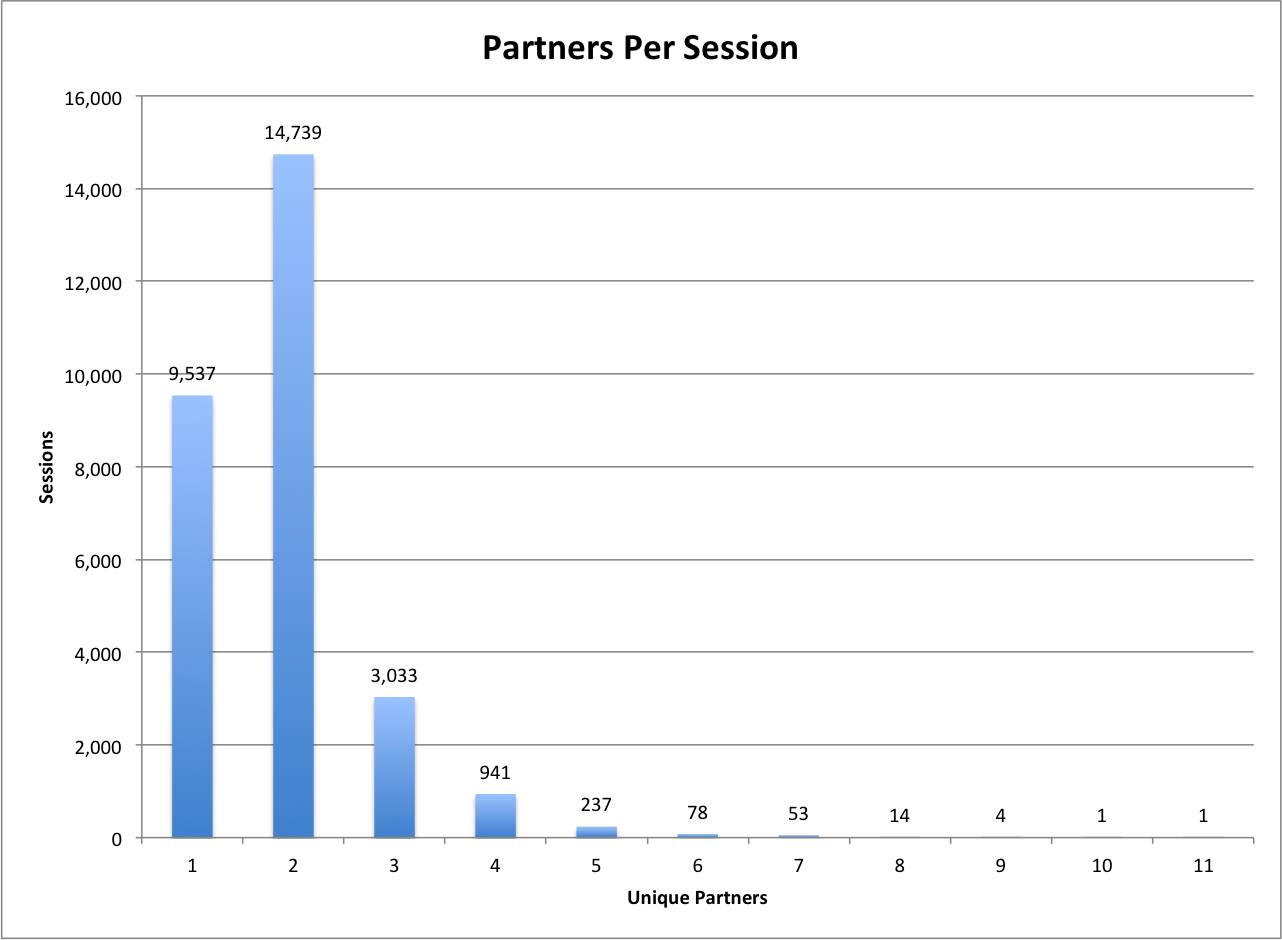
UNT Scholarly Works: Partners per Session
From the Partners Per Session graph we can see that there are many sessions that make use of items from multiple Partners in a single session. In fact 66.7% of the sessions that accessed 2-11 items made use of items from more than one Partner. To me that is really telling that there are discoveries being made that span disciplines in this collection. So a user could pull an article that was contributed by the College of Information and in the same session pull up something that is from the College of Music. That’s pretty cool.
The next thing we can look at is the number of different resource types that are used in a given session. There is generally one resource type per digital object. These resource types could be an Article, a Book Chapter, a Report, a Poster, or a Presentation. We are interested in seeing how often a session will include multiple different types of resources.
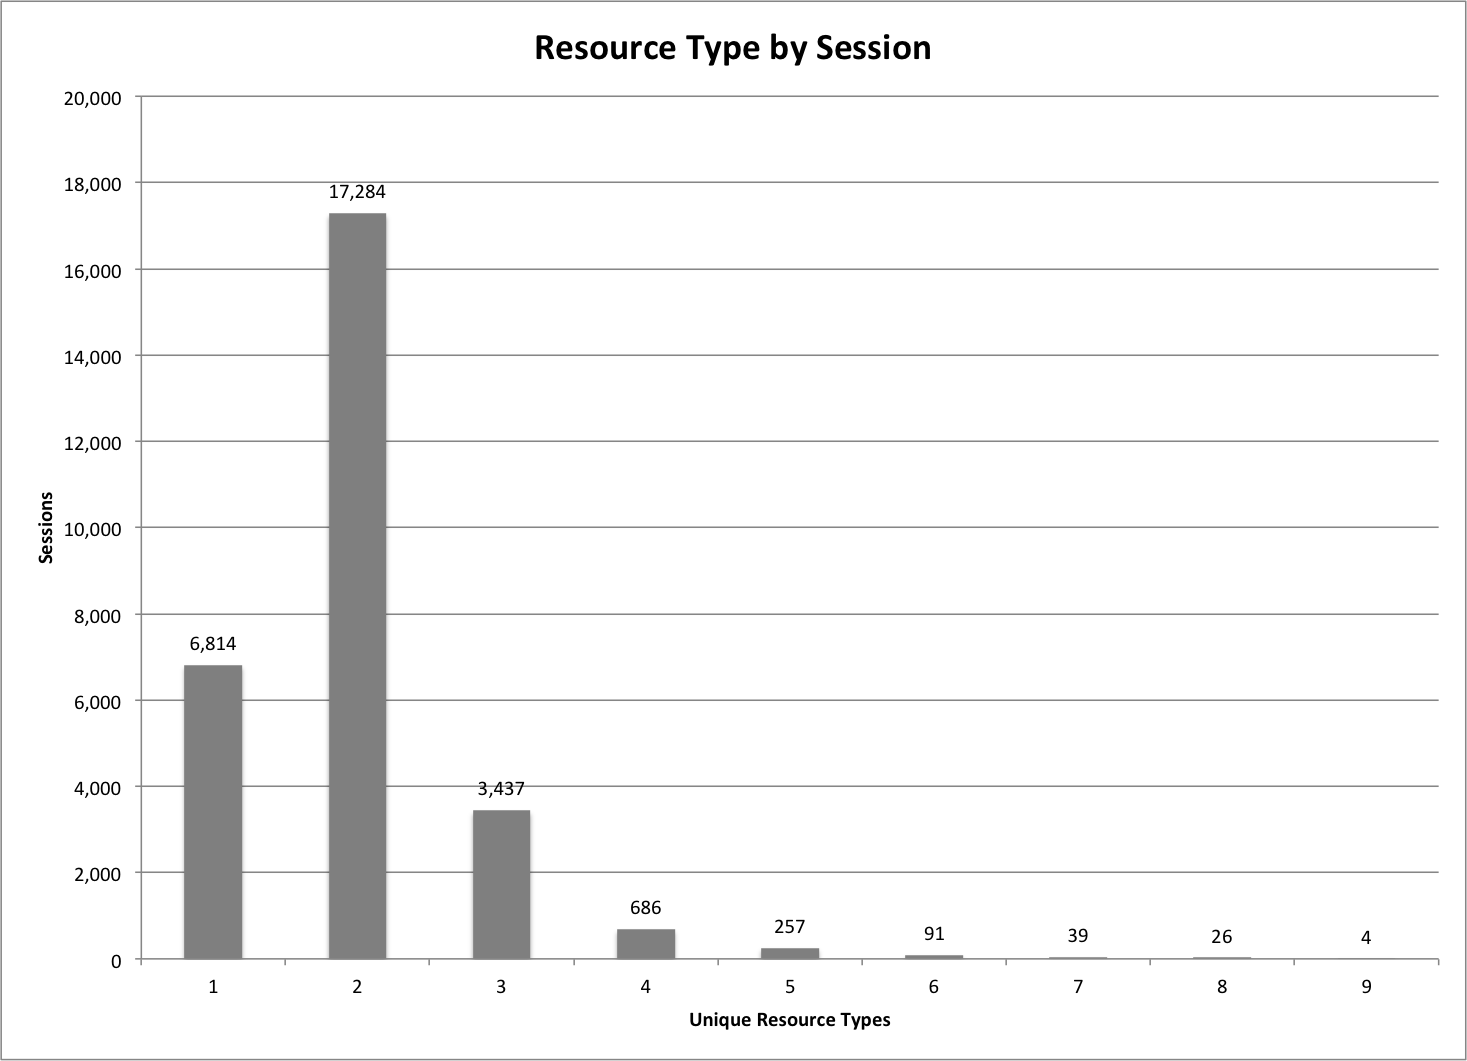
UNT Scholarly Works: Types per Session
In looking at the graph above we can see that for sessions that included between 2 and 11 items there were 76% of the sessions where users made use of items that were different types.
The final area we will look is at the collections per session. This is a little bit messier to explain because it is possible (and common) for a single digital object to have multiple collections. We had to take this into account in the way that we counted the collections per session.

UNT Scholarly Works: Collections per Session
This graph matches the same kind of pattern that we saw for Partners and Resource types. For sessions that used between two and eleven items 75% of the sessions used two or more different collection combinations. This means that when a user looked at two or more different records there was a very high chance that they were going to be pulling up a digital object that was from another collection in the UNT Digital Library.
So how does this happen? I can come up with four different ways that this can happen.
- A user is using the main search on https://digital.library.unt.edu/ and just pulls up items that are from a number of collections.
- A user is searching one of the combined search interfaces we have for the library that includes all 2 million metadata records in the UNT Libraries Digital Collections.
- A user is coming to our content from a google search that lands them in a collection and they navigate more broadly to get to a resource.
- A user has multiple different browser tabs open and might even have two different search tasks going on but they are getting combined into one session because of the way we are grouping things for this analysis.
There are probably other ways that this is happening which might be a good thing to look at in more depth in the future. I looked briefly at the full list of collections that get used together and some of the combinations aren’t immediately interpretable with a logical story of how these items were viewed together within a session. The Web gets messy.
Cross-Collection Sessions
In looking at the number of sessions that spanned more than one collection I was interested in understanding which collections were most used with the UNT Scholarly Works Repository collection.
I took all of the collections present in each session and created pairs of collections in the form of (‘UNTSW’, ‘UNTETD’) or (‘UNTSW’, ‘TRAIL’). These were then grouped and then the results placed into a table to show how everything matches up.
| UNTSW | UNTETD | OSTI | TRAIL | OTA | TDNP | MDID | CRSR | JNDS | UNTGW | |
| UNTSW | 0 | 11,147 | 1,938 | 1,126 | 1,121 | 1,118 | 952 | 703 | 676 | 302 |
| UNTETD | 11,147 | 0 | 323 | 258 | 895 | 80 | 230 | 175 | 59 | 63 |
| OSTI | 1,938 | 323 | 0 | 165 | 9 | 48 | 3 | 91 | 28 | 8 |
| TRAIL | 1,126 | 258 | 165 | 0 | 19 | 44 | 16 | 63 | 11 | 14 |
| OTA | 1,121 | 895 | 9 | 19 | 0 | 2 | 60 | 15 | 5 | 4 |
| TDNP | 1,118 | 80 | 48 | 44 | 2 | 0 | 0 | 17 | 4 | 12 |
| MDID | 952 | 230 | 3 | 16 | 60 | 0 | 0 | 3 | 2 | 1 |
| CRSR | 703 | 175 | 91 | 63 | 15 | 17 | 3 | 0 | 8 | 15 |
| JNDS | 676 | 59 | 28 | 11 | 5 | 4 | 2 | 8 | 0 | 0 |
| UNTGW | 302 | 63 | 8 | 14 | 4 | 12 | 1 | 15 | 0 | 0 |
The table needs just one piece of information to keep in mind. When you start comparing collections that don’t include UNTSW you need to remember that because we limited our dataset to sessions that included UNTSW you should always add that into your interpretation. For example if you were looking at how often do items from UNTETD (our theses and dissertation collection) get used with TRAIL (Technial Report Archive and Image Library collection) you will get 258 sessions. But you also have to add into that UNTSW so it is really, how often does UNTETD, TRAIL and UNTSW get used together which is 258.
Just looking at the first column of the table will give us the collections that are most often accessed within sessions with the UNT Scholarly Works Repository. I pulled those out into the chart below.
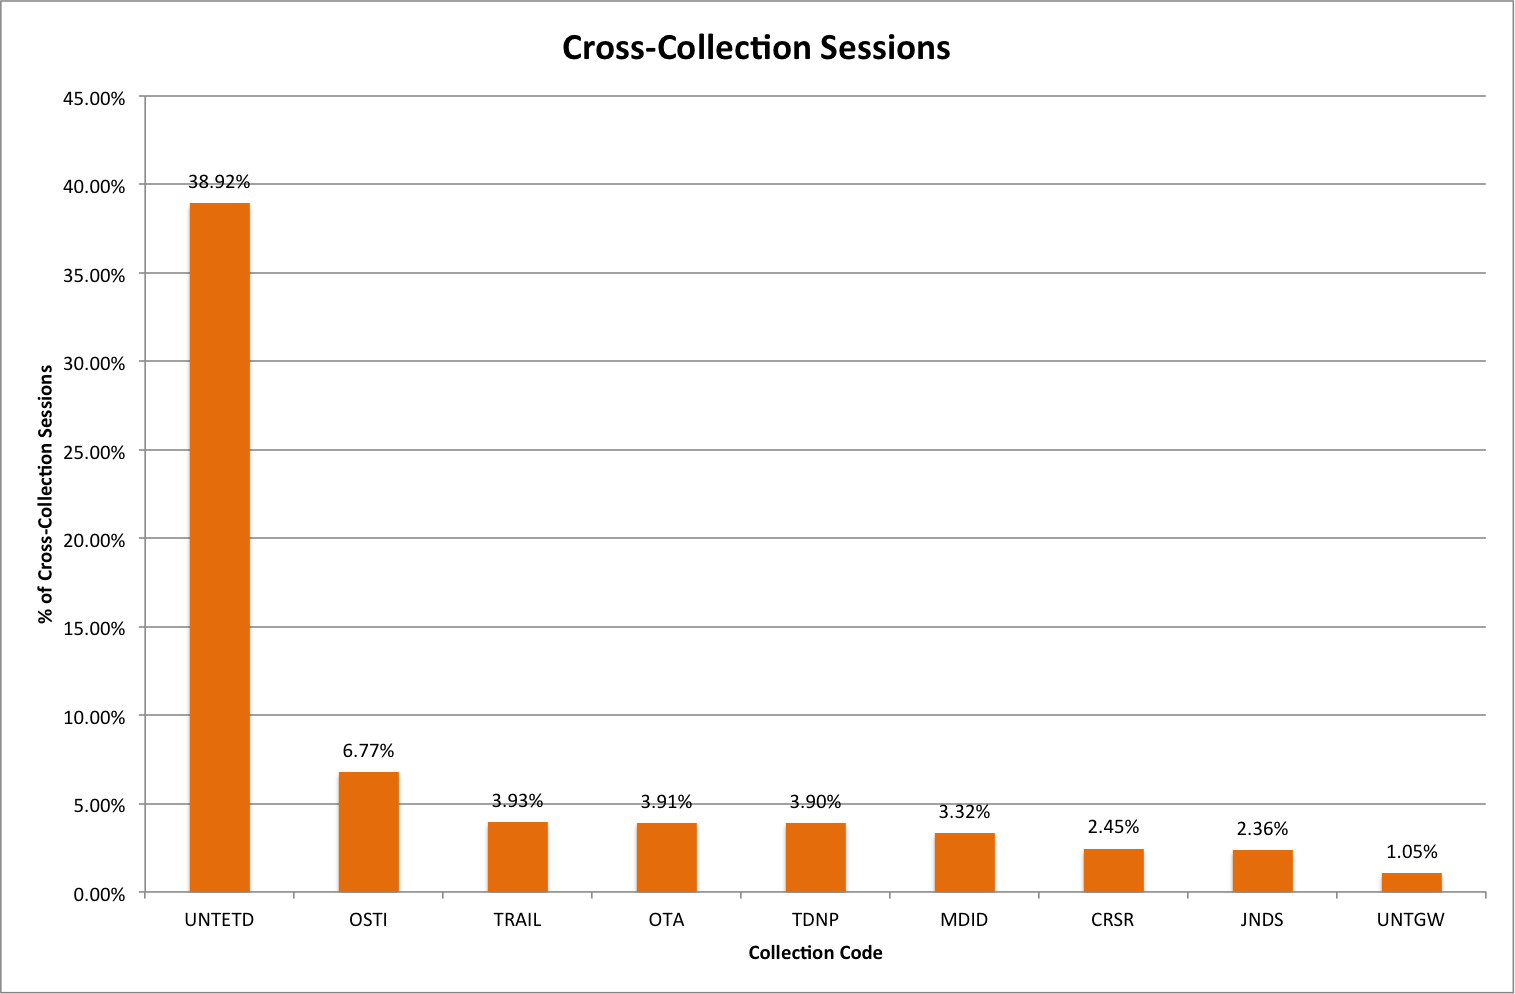
Cross-Collection Sessions
By far the most commonly used collection with the UNT Scholarly Works Repository collection is the UNT Theses and Dissertations collection. This occurs 39% of the time when there are two or more collections used in a session. The other collections drop off very quickly after UNTETD.
This analysis is just another quick stab at understanding how the digital collections are being accessed by our users. I think that there is more that we can do with this data and hopefully I’ll get around to doing a bit more analysis this summer. There are still a few research questions from our original post that we haven’t answered.
If you have questions or comments about this post, please let me know via Twitter.