Monthly Archives: November 2015

Portal to Texas History Newspaper OCR Text Datasets

Overview:

A week or so ago I had a faculty member at UNT ask if I could work with one of his students to get a copy of the OCR text of several titles of historic Texas newspapers that we have on The Portal to Texas History.

While we provide public access to the full-text for searching and discovering newspapers pages of interest to users, we don’t have a very straightforward way to publicly obtain the full-text for a given issue let along full titles that may be many tens of thousands of pages in size.

At the end of the week I had pulled roughly 79,000 issues of newspapers comprised of over 785,000 pages of OCR text. We are making these publicly available in the UNT Data Repository under a CC0 License so that others might be able to make use of them.  Feel free to jump over to the UNT Digital Library to grab a copy.

Background:

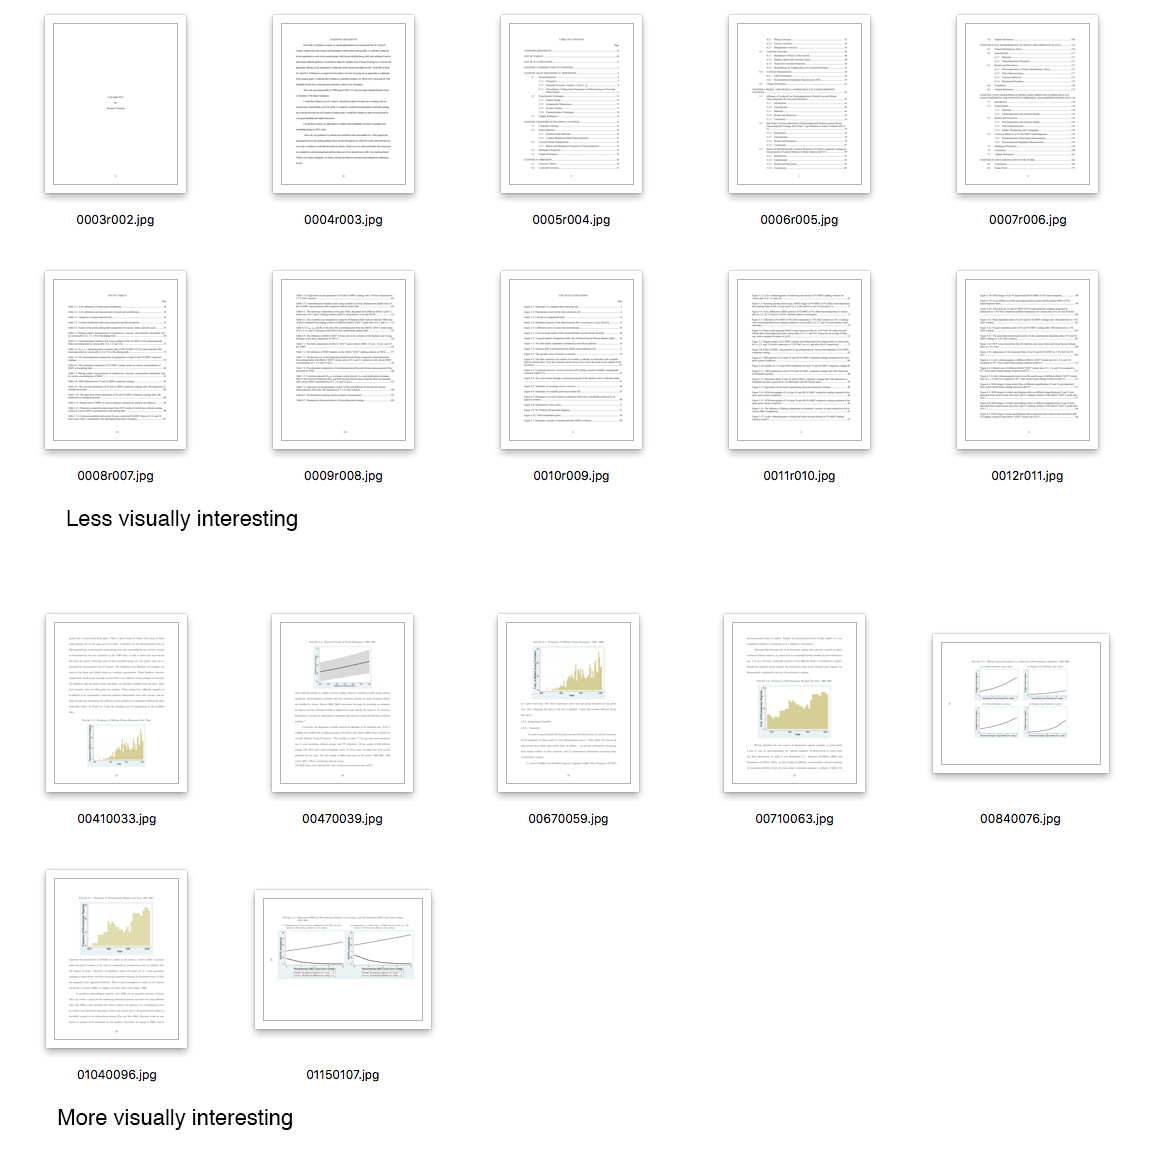
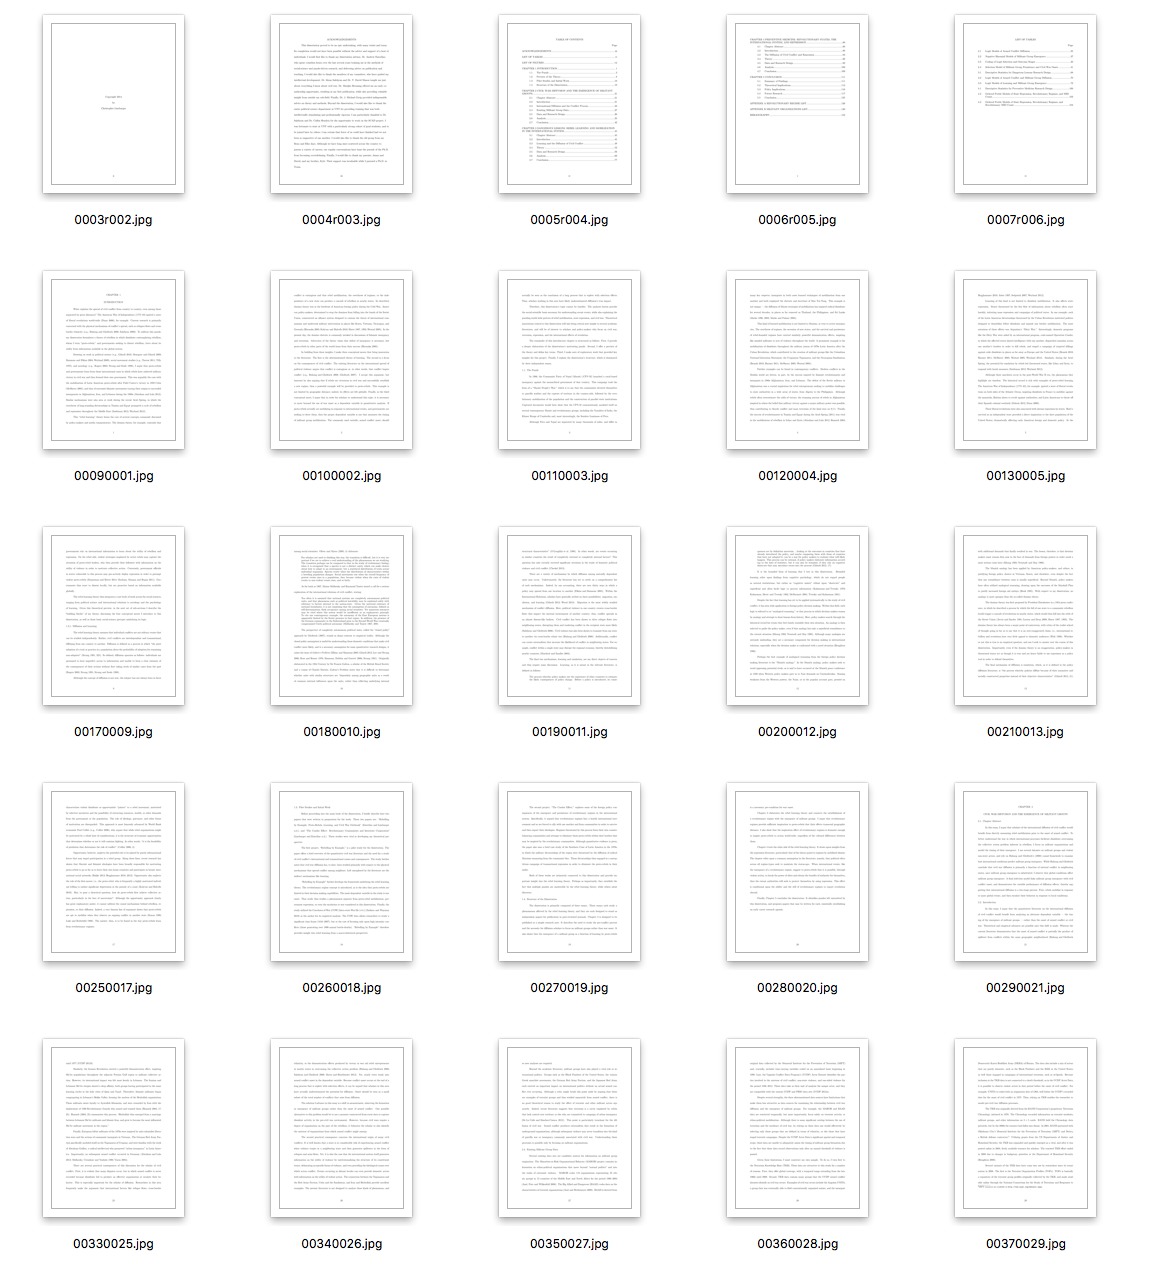
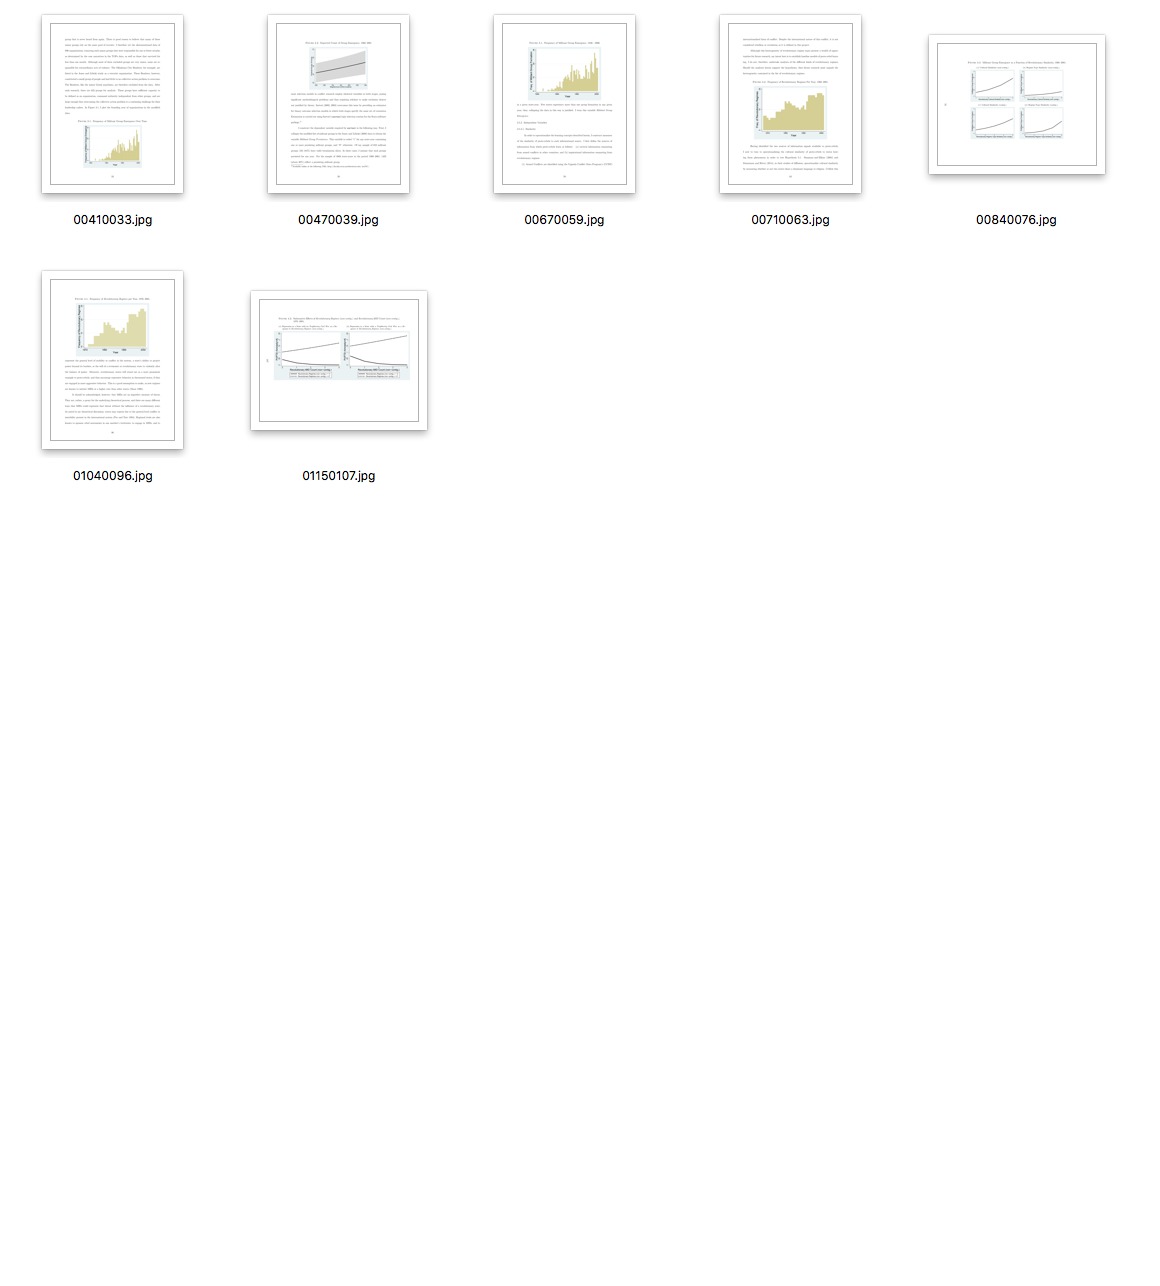
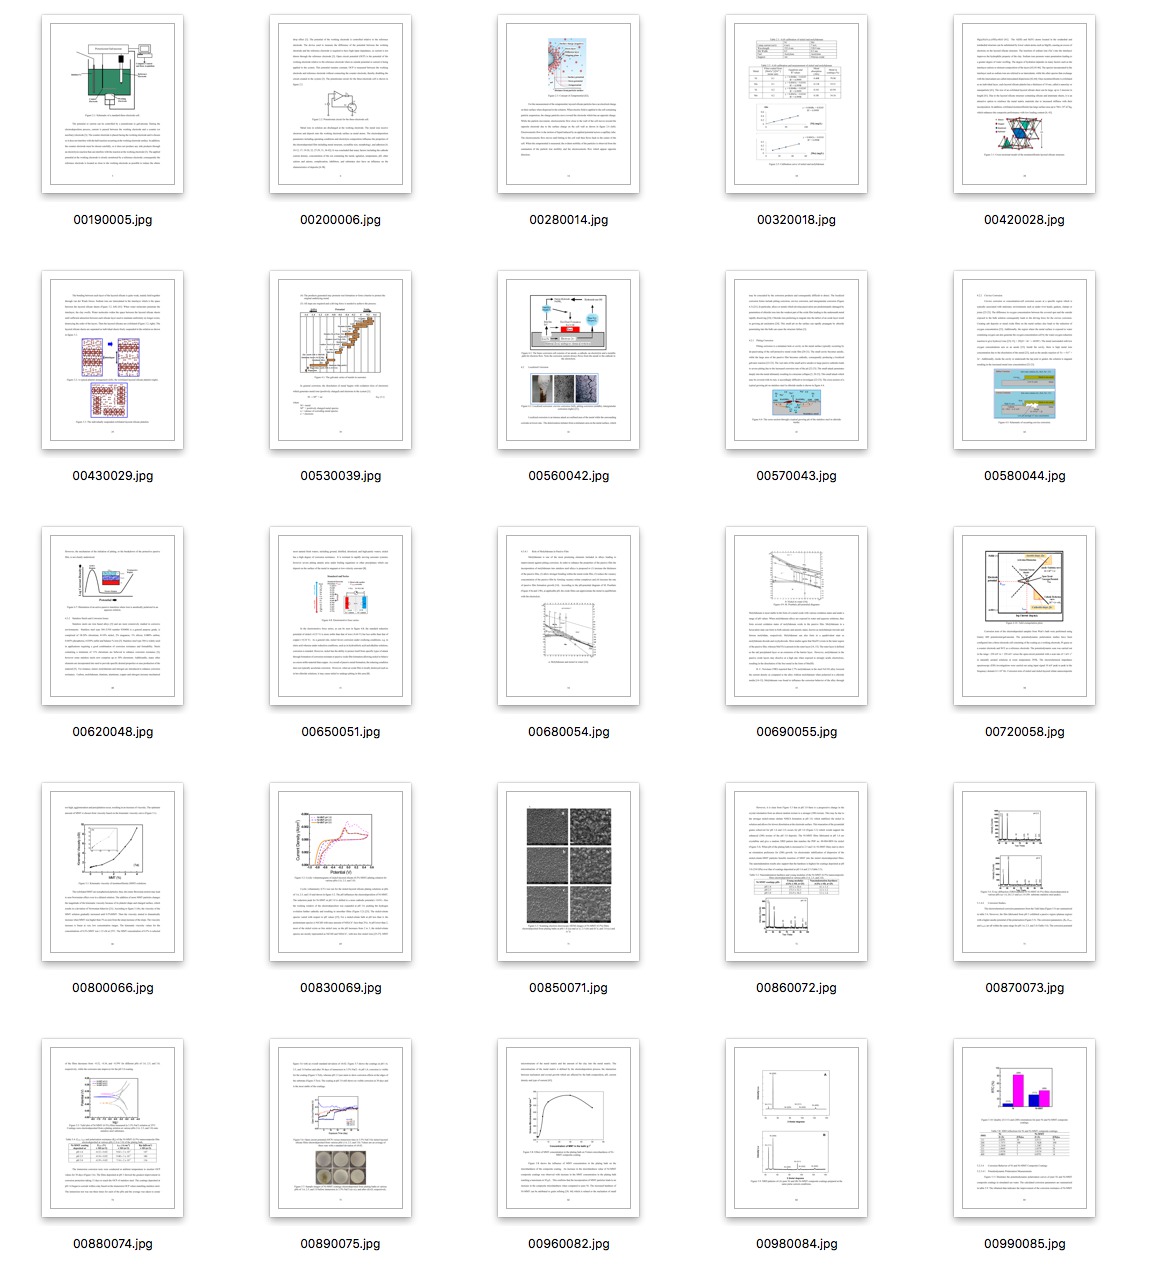
The UNT Libraries and The Portal to Texas History have operated the Texas Digital Newspaper Program for nine years with a goal of preserving and making available as many newspapers published in Texas as we are able to collect and secure rights to.  At this time we have nearly 3.5 million pages of Texas newspapers ranging from the 1830’s all the way to 2015. Jump over to the TDNP collection in the Portal to take a look at all of the content there including a list of all of the titles we have digitized.

The titles in the datasets were chosen by the student and professor and seem to be a fairly decent sampling of communities that we have in the Portal that are both large in size and have a significant number of pages of newspapers digitized.

Here is a full list of the communities, page count, issue count, and links to the dataset itself in the UNT Digital Library.

Dataset Name Community County Years Covered Issues Pages
Portal to Texas History Newspaper OCR Text Dataset: Abilene Abilene Taylor County 1888-1923 7,208 62,871
Portal to Texas History Newspaper OCR Text Dataset: Brenham Brenham Washington County 1876-1923 10,720 50,368
Portal to Texas History Newspaper OCR Text Dataset: Bryan Bryan Brazos County 1883-1922 5,843 27,360
Portal to Texas History Newspaper OCR Text Dataset: Denton Denton Denton County 1892-1911 690 4,686
Portal to Texas History Newspaper OCR Text Dataset: El Paso El Paso El Paso County 1881-1921 17,104 177,640
Portal to Texas History Newspaper OCR Text Dataset: Fort Worth Fort Worth Tarrant County 1883-1896 4,146 36,199
Portal to Texas History Newspaper OCR Text Dataset: Gainesville Gainesville Cooke County 1888-1897 2,286 9,359
Portal to Texas History Newspaper OCR Text Dataset: Galveston Galveston Galveston County 1849-1897 8,136 56,953
Portal to Texas History Newspaper OCR Text Dataset: Houston Houston Harris County 1893-1924 9,855 184,900
Portal to Texas History Newspaper OCR Text Dataset: McKinney McKinney Collin County 1880-1936 1,568 12,975
Portal to Texas History Newspaper OCR Text Dataset: San Antonio San Antonio Bexar County 1874-1920 6,866 130,726
Portal to Texas History Newspaper OCR Text Dataset: Temple Temple Bell County 1907-1922 4,627 44,633

Dataset Layout

Each of the datasets is a gzipped tar file that contains a multi-level directory structure.  In addition there is a README.txt created for each of the datasets. Here is an example of the Denton README.txt

Each of the datasets is organized by title. Here is the structure for the Denton dataset.

Denton
└── data
    ├── Denton_County_News
    ├── Denton_County_Record_and_Chronicle
    ├── Denton_Evening_News
    ├── Legal_Tender
    ├── Record_and_Chronicle
    ├── The_Denton_County_Record
    └── The_Denton_Monitor

Within each of the title folders are subfolders for each year that we have a newspaper issue for.

Denton/data/Denton_County_Record_and_Chronicle/
├── 1898
├── 1899
├── 1900
└── 1901

Finally within each of the year folders contain folders for each issue present in The Portal to Texas History on the day the dataset was extracted.

Denton
└── data
    ├── Denton_County_News
    │   ├── 1892
    │   │   ├── 18920601_metapth502981
    │   │   ├── 18920608_metapth502577
    │   │   ├── 18920615_metapth504880
    │   │   ├── 18920622_metapth504949
    │   │   ├── 18920629_metapth505077
    │   │   ├── 18920706_metapth501799
    │   │   ├── 18920713_metapth502501
    │   │   ├── 18920720_metapth502854

Each of these issue folders has the date of publication in the yyyymmdd format and the ARK identifier from the Portal for the folder name.

Each of these folders is a valid BagIt bag that can be verified with tools like bagit.py. Here is the structure for an issue.

18921229_metapth505423
├── bag-info.txt
├── bagit.txt
├── data
│   ├── metadata
│   │   ├── ark
│   │   ├── metapth505423.untl.xml
│   │   └── portal_ark
│   └── text
│       ├── 0001.txt
│       ├── 0002.txt
│       ├── 0003.txt
│       └── 0004.txt
├── manifest-md5.txt
└── tagmanifest-md5.txt

The OCR text is located in the text folder and three metadata files are present in the metadata folder. A file called ark that contains the ark identifier for this item. There is a file called portal_ark that contains the URL to this issue in The Portal to Texas History, and finally a metadata file in the UNTL metadata format.

I hope that these datasets are useful to folks interested in trying their hand at working with a large collection of OCR text from newspapers. I should remind everyone that this is uncorrected OCR text and will most likely need a fair bit of pre-processing because it is far from perfect.

If you have questions or comments about this post,  please let me know via Twitter.

Finding figures and images in Electronic Theses and Dissertations (ETD)

One of the things that we are working on at UNT is a redesign of The Portal to Texas History’s interface.  In doing so I’ve been looking around quite a bit at other digital libraries to get ideas of features that we could incorporate into our new user experience.

One feature that I found that looked pretty nifty was the “peek” interface for the Carolina Digital Repository. They make the code for this interface available to others to use if they are interested via the UNC Libraries GitHub in the peek repository.  I think this is an interesting interface but I had the question still of “how did you decide which images to choose”.  I came across the peek-data repository that suggested that the choosing of images was a manual process, and I also found a powerpoint presentation titled “A Peek Inside the Carolina Digital Repository” by Michael Daines that confirmed this is the case.  These slides are a few years old so I don’t know if the process is still manual.

I really like this idea and would love to try and implement something similar for some of our collections but the thought of manually choosing images doesn’t sound like fun at all.  I looked around a bit to see if I could borrow from some prior work that others have done.  I know that the Internet Archive and the British Library have released some large image datasets that appear to be the “interesting” images from books in their collections.

Less and More interesting images

Less and More interesting images

I ran across a blog post by Chris Adams who works on the World Digital Library at the Library of Congress called “Extracting images from scanned book pages” that seemed to be close to what I wanted to do,  but wasn’t exactly it either.

I remembered back to a Code4Lib Lightning Talk a few years back from Eric Larson called “Finding image in book page images” and the companion GitHub repository picturepages that contains the code that he used.   In reviewing the slides and looking at the code I think I found what I was looking for,  at least a starting point.

Process

What Eric proposed for finding interesting images was that you would take an image, convert it to grayscale, increase the contrast dramatically, convert this new images into a single pixel wide image that is 1500 pixels tall and sharpen the image.  That resulting image would be inverted,  have a threshold applied to it to convert everything to black or white pixels and then it would be inverted again.  Finally the resulting values of either black or white pixels are analyzed to see if there are areas of the image that are 200 or more pixels long that are solid black.

convert #{file} -colorspace Gray -contrast -contrast -contrast -contrast -contrast -contrast -contrast -contrast -resize 1X1500! -sharpen 0x5 miff:- | convert - -negate -threshold 0 -negate TXT:#{filename}.txt`

The script above which uses ImageMagick to convert an input image to greyscale, calls contrast eight times, resizes the image and the sharpens the result. It pipes this file into convert again, flips the colors, applies and threshold and flips back the colors. The output is saved as a text file instead of an image, with one line per pixel. The output looks like this.

# ImageMagick pixel enumeration: 1,1500,255,srgb
...
0,228: (255,255,255)  #FFFFFF  white
0,229: (255,255,255)  #FFFFFF  white
0,230: (255,255,255)  #FFFFFF  white
0,231: (255,255,255)  #FFFFFF  white
0,232: (0,0,0)  #000000  black
0,233: (0,0,0)  #000000  black
0,234: (0,0,0)  #000000  black
0,235: (255,255,255)  #FFFFFF  white
0,236: (255,255,255)  #FFFFFF  white
0,237: (0,0,0)  #000000  black
0,238: (0,0,0)  #000000  black
0,239: (0,0,0)  #000000  black
0,240: (0,0,0)  #000000  black
0,241: (0,0,0)  #000000  black
...

The next step was to loop through each of the lines in the file to see if there was a sequence of 200 black pixels.

I pulled a set of images from an ETD that we have in the UNT Digital Library and tried a Python port of Eric’s code that I hacked together.  For me things worked pretty well, it was able to identify the images that I would have manually pulled as pages that were “interesting” on my own.

But there was a problem that I ran into,  the process was pretty slow.

I pulled a few more sets of page images from ETDs and found that for those images it would take the ImageMagick convert process up to 23 seconds per images to create the text files that I needed to work with.  This made me ask if I could actually implement this same sort of processing workflow with just Python.

I need a Pillow

I have worked with the Python Image Library (PIL) a few times over the years and had a feeling it could do what I was interested in doing.  I ended up using Pillow which is a “friendly fork” of the original PIL library.  My thought was to apply the same processing workflow as was carried out in Eric’s script and see if doing it all in python would be reasonable.

I ended up with an image processing workflow that looks like this:

# Open image file
im = Image.open(filename)

# Convert image to grayscale image
g_im = ImageOps.grayscale(im)

# Create enhanced version of image using aggressive Contrast
e_im = ImageEnhance.Contrast(g_im).enhance(100)

# resize image into a tiny 1x1500 pixel image
# ANTIALIAS, BILINEAR, and BICUBIC work, NEAREST doesn't
t_im = e_im.resize((1, 1500), resample=Image.BICUBIC)

# Sharpen skinny image file
st_im = t_im.filter(ImageFilter.SHARPEN)

# Invert the colors
it_im = ImageOps.invert(st_im)

# If a pixel isn't black (0), make it white (255)
fixed_it_im = it_im.point(lambda x: 0 if x < 1 else 255, 'L')

# Invert the colors again
final = ImageOps.invert(fixed_it_im)

final.show()

I was then able to iterate through the pixels in the final image with the getdata() method and apply the same logic of identifying images that have sequences of black pixels that were over 200 pixels long.

Here are some examples of thumbnails from three ETDs,  first all images and then just the images identified by the above algorithm as “interesting”.

Example One

Thumbnails for ark:/67531/metadc699990/ including interesting and less visually interesting pages.

Thumbnails for ark:/67531/metadc699990/ including interesting and less visually interesting pages.

Thumbnails for ark:/67531/metadc699999/ with just visually interesting pages shown.

Thumbnails for ark:/67531/metadc699999/ with just visually interesting pages shown.


Example Two

Thumbnails for ark:/67531/metadc699999/ including interesting and less visually interesting pages.

Thumbnails for ark:/67531/metadc699999/ including interesting and less visually interesting pages.

Thumbnails for ark:/67531/metadc699999/ with just visually interesting pages shown.

Thumbnails for ark:/67531/metadc699999/ with just visually interesting pages shown.

Example Three

Thumbnails for ark:/67531/metadc699991/ including interesting and less visually interesting pages.

Thumbnails for ark:/67531/metadc699991/ including interesting and less visually interesting pages.

Thumbnails for ark:/67531/metadc699991/ with just visually interesting pages.

Thumbnails for ark:/67531/metadc699991/ with just visually interesting pages.

So in the end I was able to implement the code in Python with Pillow and a fancy little lambda function.  The speed was much improved as well.  For those same images that were taking up to 23 seconds to process with the ImageMagick version of the workflow,  I was able to process them in a tiny bit over a second with this Python version.

The full script I was using for these tests is below. You will need to download and install Pillow in order to get it to work.

I would love to hear other ideas or methods to do this kind of work, if you have thoughts, suggestions, or if I missed something in my thoughts, please let me know via Twitter.


Finding collections that have the “first of the month” problem.

A few weeks ago I wrote a blog post exploring the dates in the UNT Libraries’ Digital Collections. I got a few responses from that post on Twitter with one person stating that the number of Jan 1, publication dates seemed high and maybe there was something a little fishy there.  After looking at the numbers a little more, I think they were absolutely right, there was something fishy going on.

First day of the month problem.

First day of the month problem.

I worked up the graphic above to try and highlight what the problem is.  In looking above you can see that there are very large spikes on the first day of each of the months (you may have to look really closely at that image to see the dates) and a large spike on the last day of the year, December 31.

I created this graphic by taking the 967,257 dates that in the previous post I classified as “Day” and stripped the year.  I then counted the number of times a date occurred, like 01-01 for Jan 1, or 03-04 for March 4, and plotted those to the graph.

Problem Identified, Now What?

So after I looked at that graph,  I got sad… so many dates that might be wrong that we would need to change.  I guess part of the process of fixing metadata is to know if there is something to fix.  The next thing I wanted to do was to figure out which collections had a case of the “first day of the month” and which collections didn’t have this problem.

I decided to apply my horribly limited knowledge of statistics and my highly developed skills with Google to come up with some way of identifying these collections programatically. We currently have 770 different collections in the UNT Libraries’ Digital Collections and I didn’t want to go about this by hand.

So my thought was that if I was to calculate the linear regression for a month of data I would be able to use the slope of the regression in identifying collections that might have issues.  Once again I grouped all months together, so if we had a 100 year run of newspapers, all of those published on January would be together, just as April, and December.  This left me with twelve slope values per collection.  Some of the slopes were negative numbers and some were positive.  I decided that I would take the average of the absolute values of each of these slopes to come up with my first metric.

Here are the top ten collections and their absolute slope average.

Collection Name Collection Code Avg. Abs Slope
Office of Scientific & Technical Information Technical Reports OSTI 19.03
Technical Report Archive and Image Library TRAIL 4.47
National Advisory Committee for Aeronautics Collection NACA 4.45
Oklahoma Publishing Company Photography Collection OKPCP 4.03
Texas Digital Newspaper Program TDNP 2.76
Defense Base Closure and Realignment Commission BRAC 1.25
United States Census Map Collection USCMC 1.06
Abilene Library Consortium ABCM 0.99
Government Accountability Office Reports GAORT 0.95
John F. Kennedy Memorial Collection JFKAM 0.78

Obviously the OSTI collection has the highest Average Absolute Slope metric at 19.03. Next comes TRAIL at 4.47 and NACA at 4.45.  It should be noted that the NACA collection is a subset of the TRAIL collection so there is some influence in the numbers from NACA onto the TRAIL collection.  Then we have the OKPCP collection at 4.03.

In looking at the top six collections listed in the above table,  I can easily see how they could run into this “first of the month” problem.  OSTI, NACA and BRAC were all created from documents harvested from federal websites.  I can imagine that in situations where they were entering metadata, the tools they were using may have required a full date in the format of mm/dd/yy or yyyy-mm-dd,  if the month is the only thing designated on the report you would mark it as being the first of that month so that the date would validate.

The OKPCP and TDNP collections have similar reasons as to why they would have an issue.

I used matplotlib to plot the monthly slopes to a graphic so that I could see what was going on. Here is a graphic for the OSTI collection.

OSTI - Monthly Slopes

OSTI – Monthly Slopes

In contrast to the OSTI Monthly Slopes graphic above,  here is a graphic of the WLTC collection that has an Average Absolute Slope of 0.000352 (much much smaller than OSTI)

WLTC - Monthly Slopes

WLTC – Monthly Slopes

When looking at these you really have to pay attention to the scale of each of the subplots in order to see how much the slopes of the OSTI – Monthly Slopes are really falling or rising.

Trying something a little different.

The previous work was helpful in identifying which of the collections had the biggest “first day of the month” problems.  I wasn’t too surprised with the results I got from the top ten.  I wanted to normalize the numbers a bit to see if I could tease out some of the collections that had smaller numbers of items that might also have this problem but were getting overshadowed by the large OSTI collection (74,000+ items) or the TRAIL collection (18,000+ items).

I went about things in a similar fashion but this time I decided to work with the percentages for each day of a month instead of a raw count.

For the month of January for the NACA collection,  here is what the difference would be for the calculations.

Day of the Month Item County Percentage of Total
1 2,249 82%
2 9 0%
3 3 0%
4 12 0%
5 9 0%
6 9 0%
7 19 1%
8 9 0%
9 18 1%
10 25 1%
11 14 1%
12 20 1%
13 18 1%
14 21 1%
15 18 1%
16 28 1%
17 21 1%
18 18 1%
19 19 1%
20 24 1%
21 24 1%
22 22 1%
23 8 0%
24 20 1%
25 18 1%
26 8 0%
27 10 0%
28 24 1%
29 15 1%
30 16 1%
31 9 0%

Instead of the “Item County” I would use the “Percentage of Total” for the calculation of the slope and the graphics that I would generate. Hopeful that I would be able to uncover some different collections this way.

Below is the table for the top ten collections and their Average Absolute Slope based on Precent of items for a given month.

Collection Name Collection Name Avg. Abs Slope of %
Age Index AGE 0.63
Fraternity FRAT 0.63
The Indian Advocate (Sacred Heart, OK) INDIAN 0.63
Southwest Chinese Journal SWCJ 0.58
Benson Latin American Collection BLA 0.39
National Advisory Committee for Aeronautics Collection NACA 0.38
Technical Report Archive and Image Library TRAIL 0.36
Norman Dietel Photograph Collection NDLPC 0.34
Boone Collection Bank Notes BCBN 0.33
Office of Scientific & Technical Information Technical Reports OSTI 0.32

If you compare this to the first table in the post you will see that there are some new collections present. The first four of these are actually newspaper collections and in the case of several of them, they consist of issues that were published on a monthly basis but were notated during the digitization as being published on the first of the month because of some of the data structures that were in place for the digitization process. So we’ve identified more collections that have the “first day of the month problem”

FRAT - Percentage Range

FRAT – Percentage Range

You can see that there is a consistent slope from the upper left to lower right on each of the months of the FRAT collection.  For me this signifies a collection that may be suffering from the “first day of the month” problem.  A nice thing about using the percentages instead of the counts directly is that we are able to find collections that are much smaller in terms  of numbers, for example the FRAT has only 22 records.  If we just used the counts directly these might get lost because they would have a smaller slope than that of OSTI which has many many more records.

For good measure here is the plot of the OSTI records so you can see how it differs from the count based plots.

OSTI - Percentage Range

OSTI – Percentage Range

You can see that it retained the overall shape of the slopes but it doesn’t clobber the smaller collections when you try to find collections that have issues.

Closing

I fully expect that I misused some of the math in this work or missed other obvious ways to accomplish a similar result.  If a I did, do get in touch and let me know.

I think that this is a good start as a set of methods to identify collections in the UNT Libraries’ Digital Collections that suffer from the “first day of the month problem” and once identified it is just a matter of time and some effort to get these dates corrected in the metadata.

Hope you enjoyed my musings here, if you have thoughts, suggestions, or if I missed something in my thoughts,  please let me know via Twitter.