Last year I took a look at the subject field and the date fields in the Digital Public Library of America (DPLA). This time around I wanted to begin looking at the description field and see what I could see.
Before diving into the analysis, I think it is important to take a look at a few things. First off, when you reference the DPLA Metadata Application Profile v4, you may notice that the description field is not a required field, in fact the field doesn’t show up in APPENDIX B: REQUIRED, REQUIRED IF AVAILABLE, AND RECOMMENDED PROPERTIES. From that you can assume that this field is very optional. Also, the description field when present is often used to communicate a variety of information to the user. The DPLA data has examples that are clearly rights statements, notes, physical descriptions of the item, content descriptions of the item, and in some instances a place to store identifiers or names. Of all of the fields that one will come into contact in the DPLA dataset, I would image that the description field is probably one of the ones with the highest variability of content. So with that giant caveat, let’s get started.
So on to the data.
The DPLA makes available a data dump of the metadata in their system. Last year I was analyzing just over 8 million records, this year the collection has grown to more than 11 million records ( 11,654,800 in the dataset I’m using).
The first thing that I had to accomplish was to pull out just the descriptions from the full json dataset that I downloaded. I was interested in three values for each record, specifically the Provider or “Hub”, the DPLA identifier for the item and finally the description fields. I finally took the time to look at jq, which made this pretty easy.
For those that are interested here is what I came up with to extract the data I wanted.
zcat all.json.gz | jq -nc --stream --compact-output '. | fromstream(1|truncate_stream(inputs)) | {'provider': (._source.provider["@id"]), 'id': (._source.id), 'descriptions': ._source.sourceResource.description?}'
This results in an output that look like this.
{"provider":"http://dp.la/api/contributor/cdl","id":"4fce5c56d60170c685f1dc4ae8fb04bf","descriptions":["Lang: Charles Aikin Collection"]}
{"provider":"http://dp.la/api/contributor/cdl","id":"bca3f20535ed74edb20df6c738184a84","descriptions":["Lang: Maire, graveur."]}
{"provider":"http://dp.la/api/contributor/cdl","id":"76ceb3f9105098f69809b47aacd4e4e0","descriptions":null}
{"provider":"http://dp.la/api/contributor/cdl","id":"88c69f6d29b5dd37e912f7f0660c67c6","descriptions":null}
From there my plan was to write some short python scripts that can read a line, convert it from json into a python object and then do programmy stuff with it.
Who has what?
After parsing the data a bit I wanted to remind myself of the spread of the data in the DPLA collection. There is a page on the DPLA’s site http://dp.la/partners/ that shows you how many records have been contributed by which Hub in the network. This is helpful but I wanted to draw a bar graph to give a visual representation of this data.
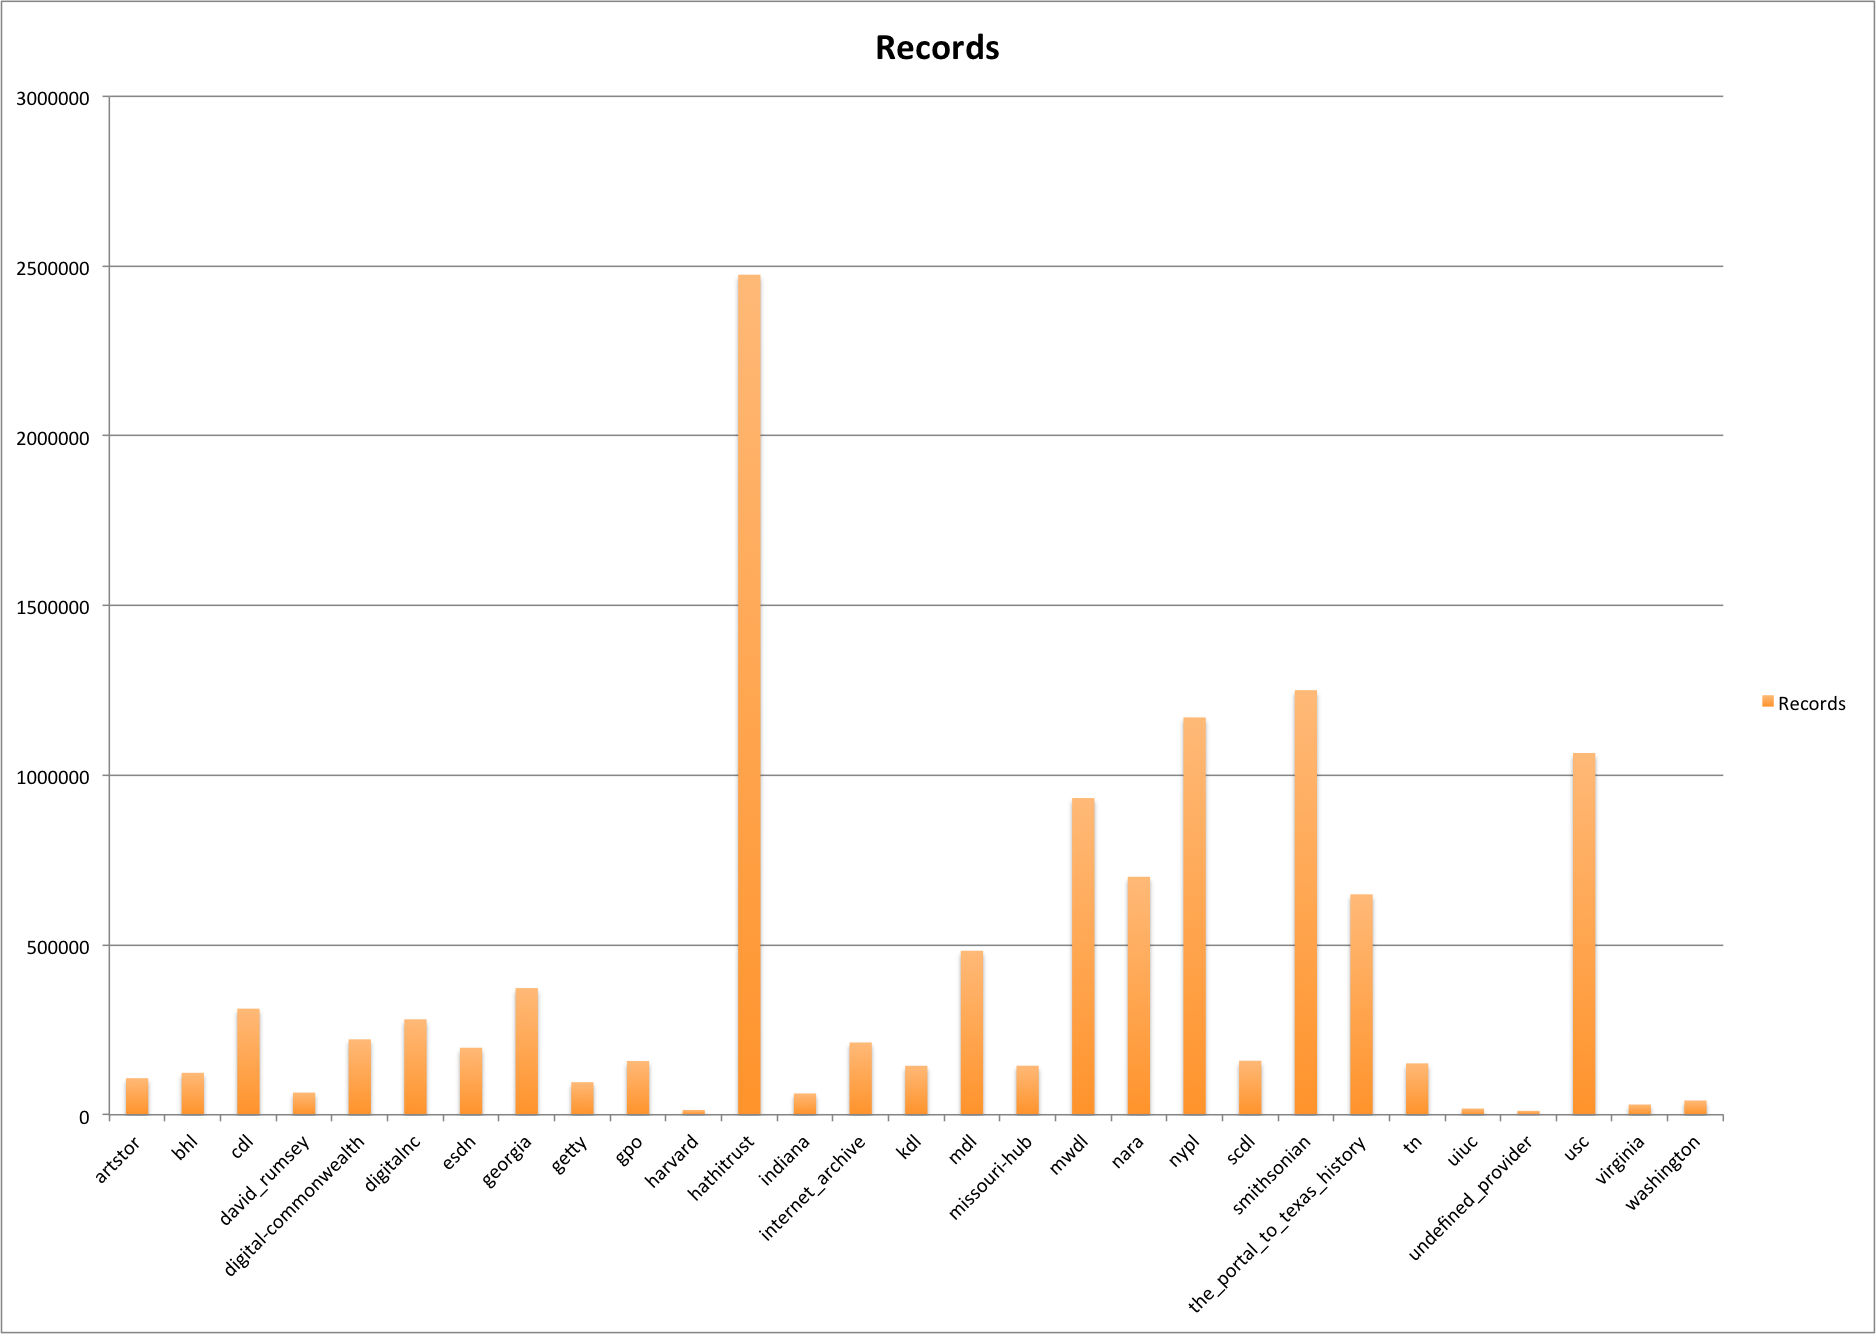
DPLA Partner Records
As has been the case since it was added, Hathitrust is the biggest provider of records to the DPLA with other 2.4 million records. Pretty amazing!
There are three other Hubs/Providers that contribute over 1 million records each, The Smithsonian, New York Public Library, and the University of Southern California Libraries. Down from there there are three more that contribute over half a million records, Mountain West Digital Library, National Archives and Records Administration (NARA) and The Portal to Texas History.
There were 11,410 records (coded as undefined_provider) that are not currently associated with a Hub/Provider, probably a data conversion error somewhere during the record ingest pipeline.
Which have descriptions
After the reminder about the size and shape of the Hubs/Providers in the DPLA dataset, we can dive right into the data and see quickly how well represented in the data the description field is.
We can start off with another graph.
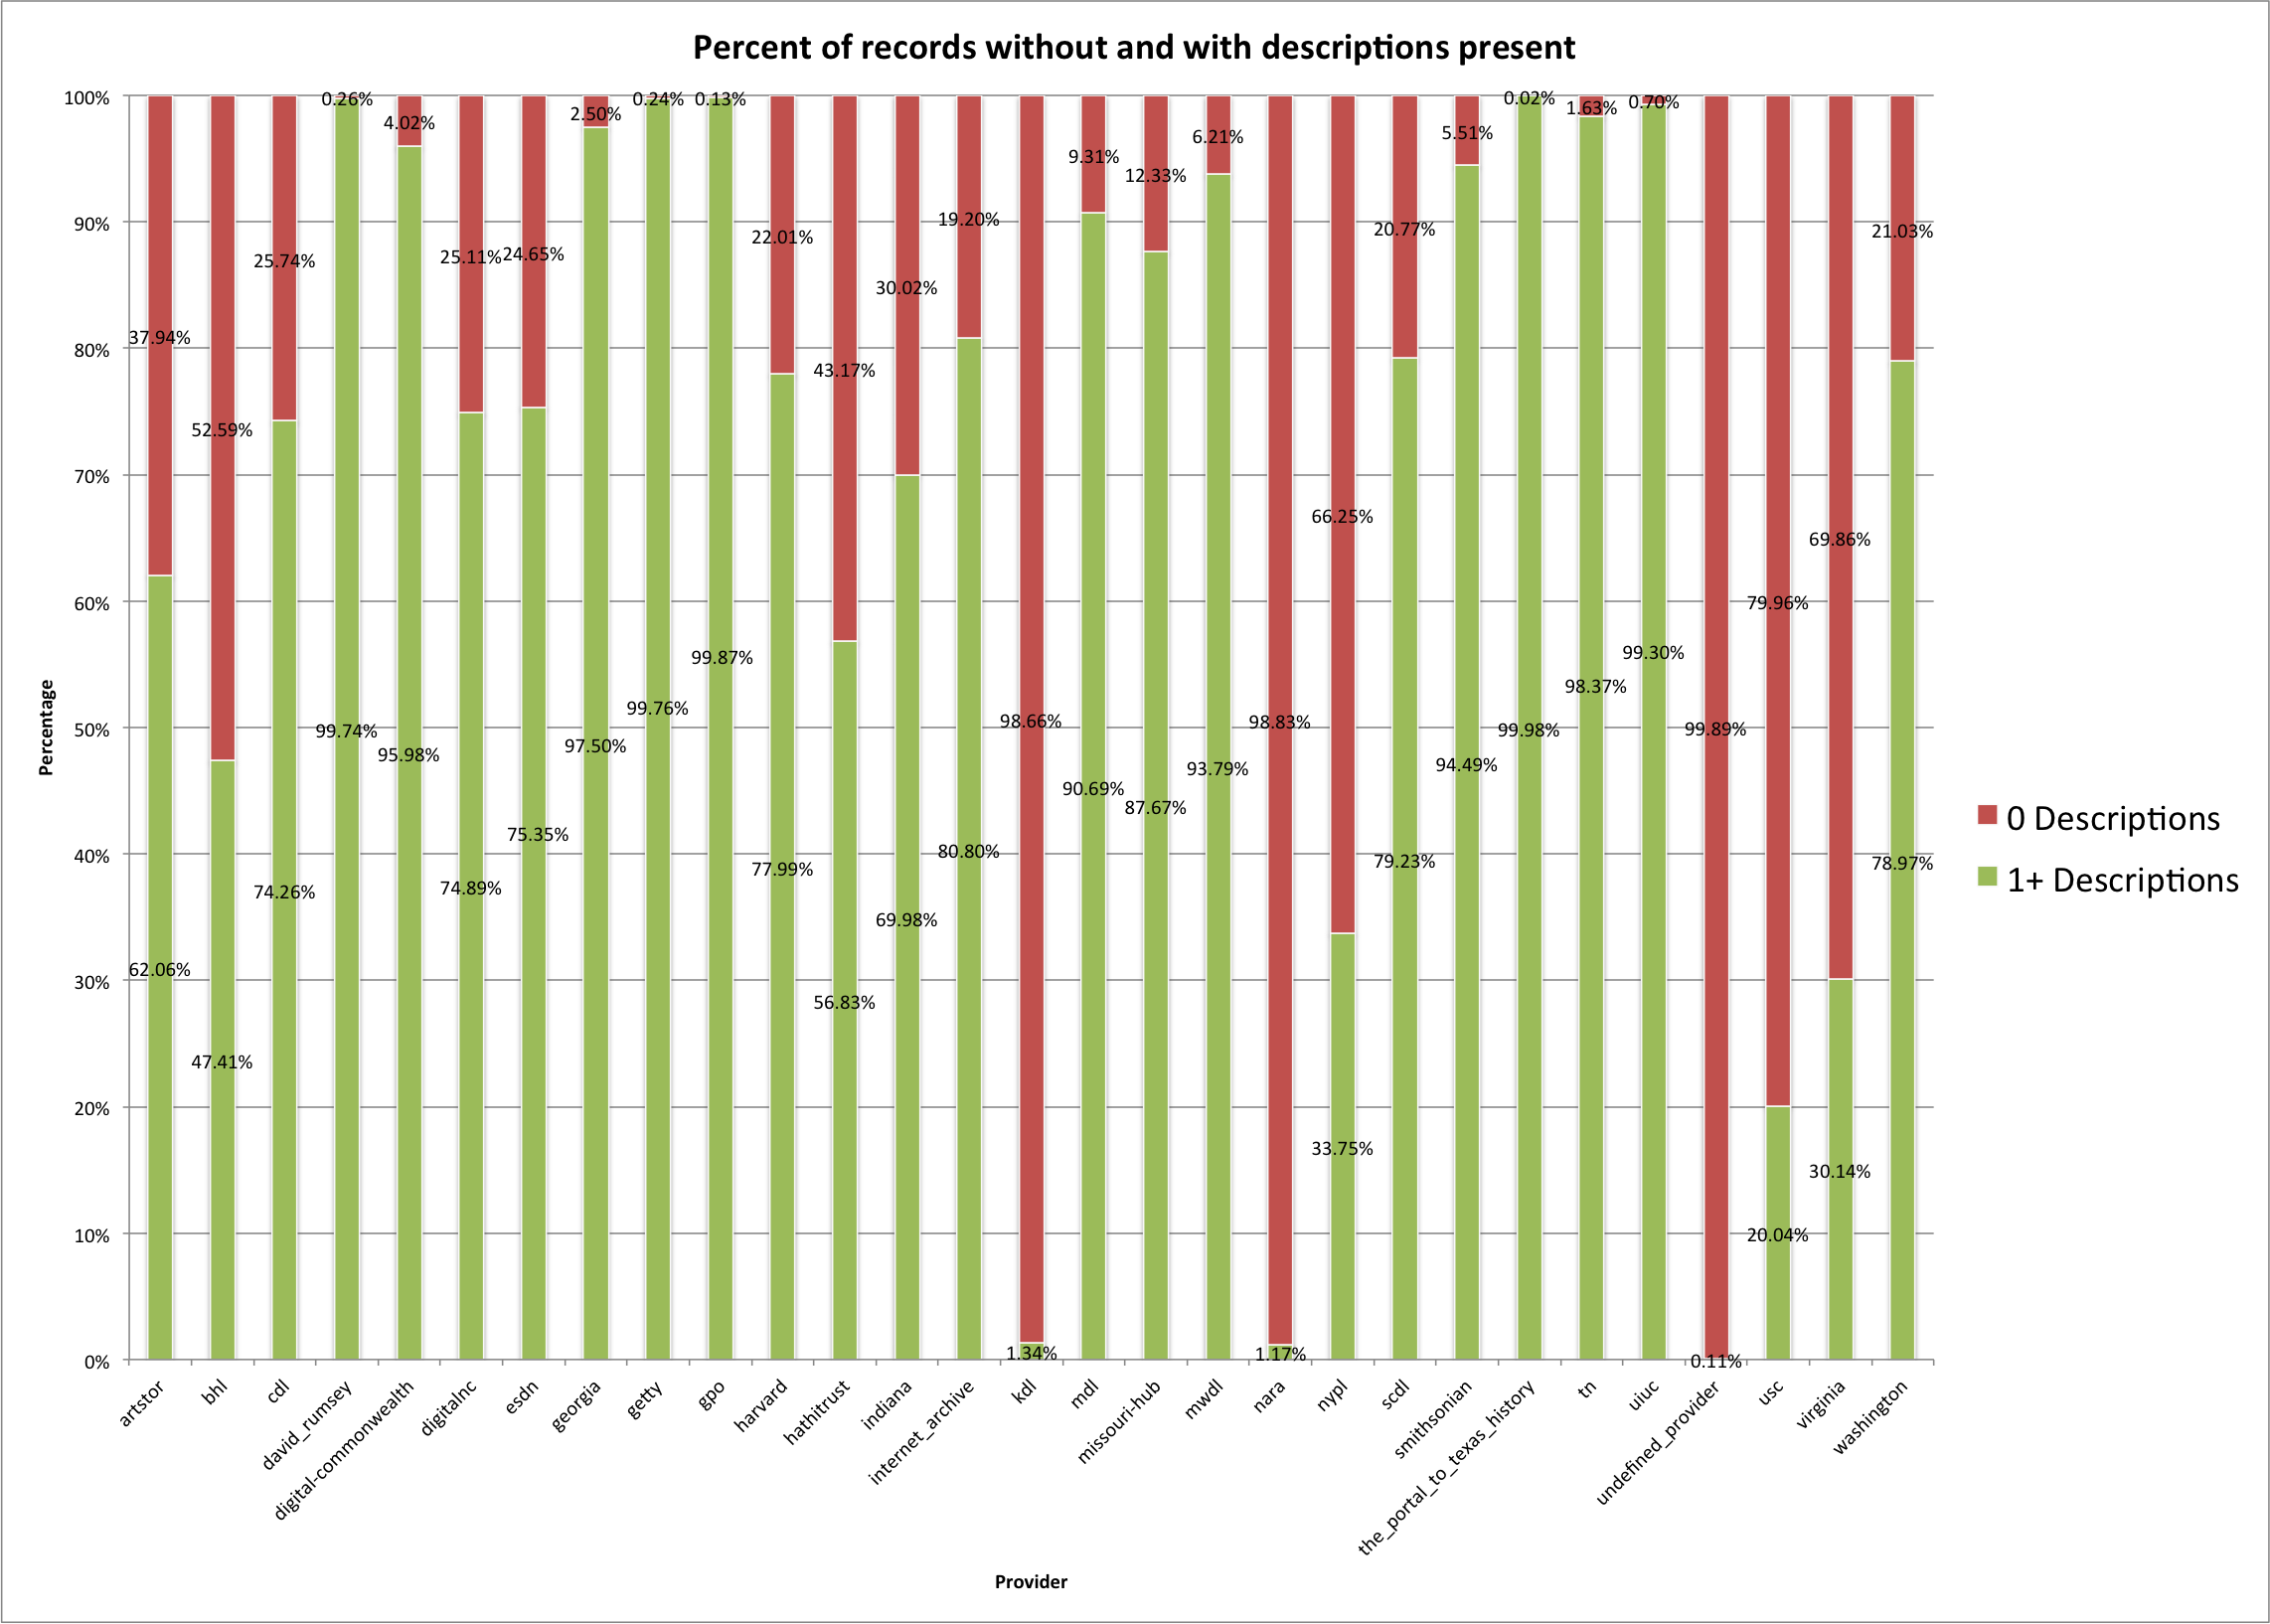
Percent of Hubs/Providers with and without descriptions
You can see that some of the Hubs/Providers have very few records (< 2%) with descriptions (Kentucky Digital Library, NARA) while others had a very high percentage (> 95%) of records with description fields present (David Rumsey, Digital Commonwealth, Digital Library of Georgia, J. Paul Getty Trust, Government Publishing Office, The Portal to Texas History, Tennessee Digital Library, and the University of Illinois at Urbana-Champaign).
Below is a full breakdown for each Hub/Provider showing how many and what percentage of the records have zero descriptions, or one or more descriptions.
| Provider | Records | 0 Descriptions | 1+ Descriptions | 0 Descriptions % | 1+ Descriptions % |
| artstor | 107,665 | 40,851 | 66,814 | 37.94% | 62.06% |
| bhl | 123,472 | 64,928 | 58,544 | 52.59% | 47.41% |
| cdl | 312,573 | 80,450 | 232,123 | 25.74% | 74.26% |
| david_rumsey | 65,244 | 168 | 65,076 | 0.26% | 99.74% |
| digital-commonwealth | 222,102 | 8,932 | 213,170 | 4.02% | 95.98% |
| digitalnc | 281,087 | 70,583 | 210,504 | 25.11% | 74.89% |
| esdn | 197,396 | 48,660 | 148,736 | 24.65% | 75.35% |
| georgia | 373,083 | 9,344 | 363,739 | 2.50% | 97.50% |
| getty | 95,908 | 229 | 95,679 | 0.24% | 99.76% |
| gpo | 158,228 | 207 | 158,021 | 0.13% | 99.87% |
| harvard | 14,112 | 3,106 | 11,006 | 22.01% | 77.99% |
| hathitrust | 2,474,530 | 1,068,159 | 1,406,371 | 43.17% | 56.83% |
| indiana | 62,695 | 18,819 | 43,876 | 30.02% | 69.98% |
| internet_archive | 212,902 | 40,877 | 172,025 | 19.20% | 80.80% |
| kdl | 144,202 | 142,268 | 1,934 | 98.66% | 1.34% |
| mdl | 483,086 | 44,989 | 438,097 | 9.31% | 90.69% |
| missouri-hub | 144,424 | 17,808 | 126,616 | 12.33% | 87.67% |
| mwdl | 932,808 | 57,899 | 874,909 | 6.21% | 93.79% |
| nara | 700,948 | 692,759 | 8,189 | 98.83% | 1.17% |
| nypl | 1,170,436 | 775,361 | 395,075 | 66.25% | 33.75% |
| scdl | 159,092 | 33,036 | 126,056 | 20.77% | 79.23% |
| smithsonian | 1,250,705 | 68,871 | 1,181,834 | 5.51% | 94.49% |
| the_portal_to_texas_history | 649,276 | 125 | 649,151 | 0.02% | 99.98% |
| tn | 151,334 | 2,463 | 148,871 | 1.63% | 98.37% |
| uiuc | 18,231 | 127 | 18,104 | 0.70% | 99.30% |
| undefined_provider | 11,422 | 11,410 | 12 | 99.89% | 0.11% |
| usc | 1,065,641 | 852,076 | 213,565 | 79.96% | 20.04% |
| virginia | 30,174 | 21,081 | 9,093 | 69.86% | 30.14% |
| washington | 42,024 | 8,838 | 33,186 | 21.03% | 78.97% |
With so many of the Hub/Providers having a high percentage of records with descriptions, I was curious about the overall records in the DPLA. Below is a pie chart that shows you what I found.
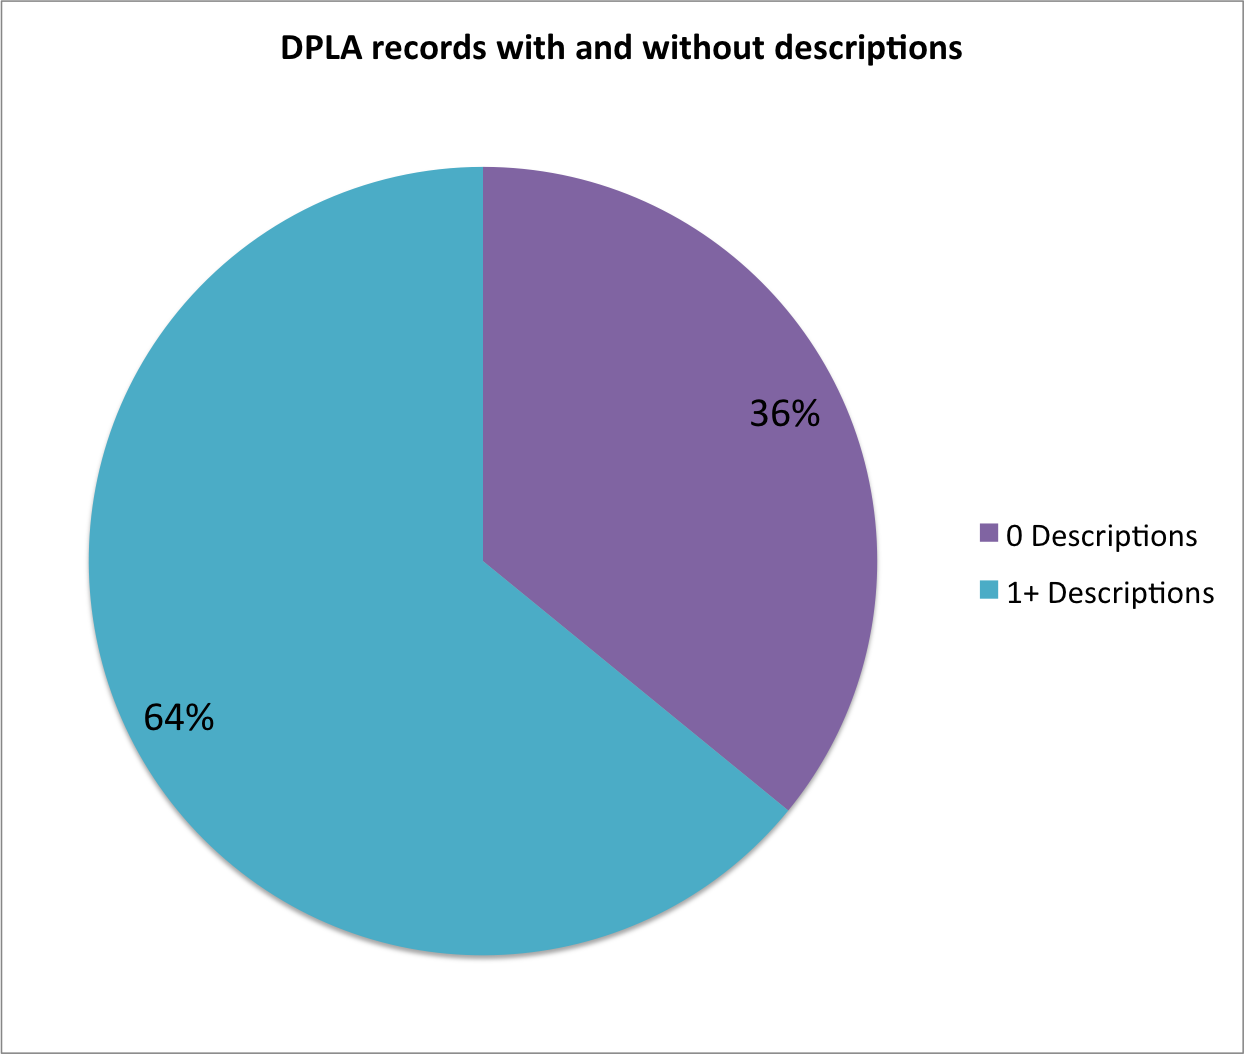
DPLA records with and without descriptions
Almost 2/3 of the records in the DPLA have at least one description field, this is more than I would have expected for an un-required, un-recommended field, but I think this is probably a good thing.
Descriptions per record
The final thing I wanted to look at in this post was the average number of description fields for each of the Hubs/Providers. This time we will start off with the data table below.
| Provider | Providers | min | median | max | mean | stddev |
| artstor | 107,665 | 0 | 1 | 5 | 0.82 | 0.84 |
| bhl | 123,472 | 0 | 0 | 1 | 0.47 | 0.50 |
| cdl | 312,573 | 0 | 1 | 10 | 1.55 | 1.46 |
| david_rumsey | 65,244 | 0 | 3 | 4 | 2.55 | 0.80 |
| digital-commonwealth | 222,102 | 0 | 2 | 17 | 2.01 | 1.15 |
| digitalnc | 281,087 | 0 | 1 | 19 | 0.86 | 0.67 |
| esdn | 197,396 | 0 | 1 | 1 | 0.75 | 0.43 |
| georgia | 373,083 | 0 | 2 | 98 | 2.32 | 1.56 |
| getty | 95,908 | 0 | 2 | 25 | 2.75 | 2.59 |
| gpo | 158,228 | 0 | 4 | 65 | 4.37 | 2.53 |
| harvard | 14,112 | 0 | 1 | 11 | 1.46 | 1.24 |
| hathitrust | 2,474,530 | 0 | 1 | 77 | 1.22 | 1.57 |
| indiana | 62,695 | 0 | 1 | 98 | 0.91 | 1.21 |
| internet_archive | 212,902 | 0 | 2 | 35 | 2.27 | 2.29 |
| kdl | 144,202 | 0 | 0 | 1 | 0.01 | 0.12 |
| mdl | 483,086 | 0 | 1 | 1 | 0.91 | 0.29 |
| missouri-hub | 144,424 | 0 | 1 | 16 | 1.05 | 0.70 |
| mwdl | 932,808 | 0 | 1 | 15 | 1.22 | 0.86 |
| nara | 700,948 | 0 | 0 | 1 | 0.01 | 0.11 |
| nypl | 1,170,436 | 0 | 0 | 2 | 0.34 | 0.47 |
| scdl | 159,092 | 0 | 1 | 16 | 0.80 | 0.41 |
| smithsonian | 1,250,705 | 0 | 2 | 179 | 2.19 | 1.94 |
| the_portal_to_texas_history | 649,276 | 0 | 2 | 3 | 1.96 | 0.20 |
| tn | 151,334 | 0 | 1 | 1 | 0.98 | 0.13 |
| uiuc | 18,231 | 0 | 3 | 25 | 3.47 | 2.13 |
| undefined_provider | 11,422 | 0 | 0 | 4 | 0.00 | 0.08 |
| usc | 1,065,641 | 0 | 0 | 6 | 0.21 | 0.43 |
| virginia | 30,174 | 0 | 0 | 1 | 0.30 | 0.46 |
| washington | 42,024 | 0 | 1 | 1 | 0.79 | 0.41 |
This time with an image
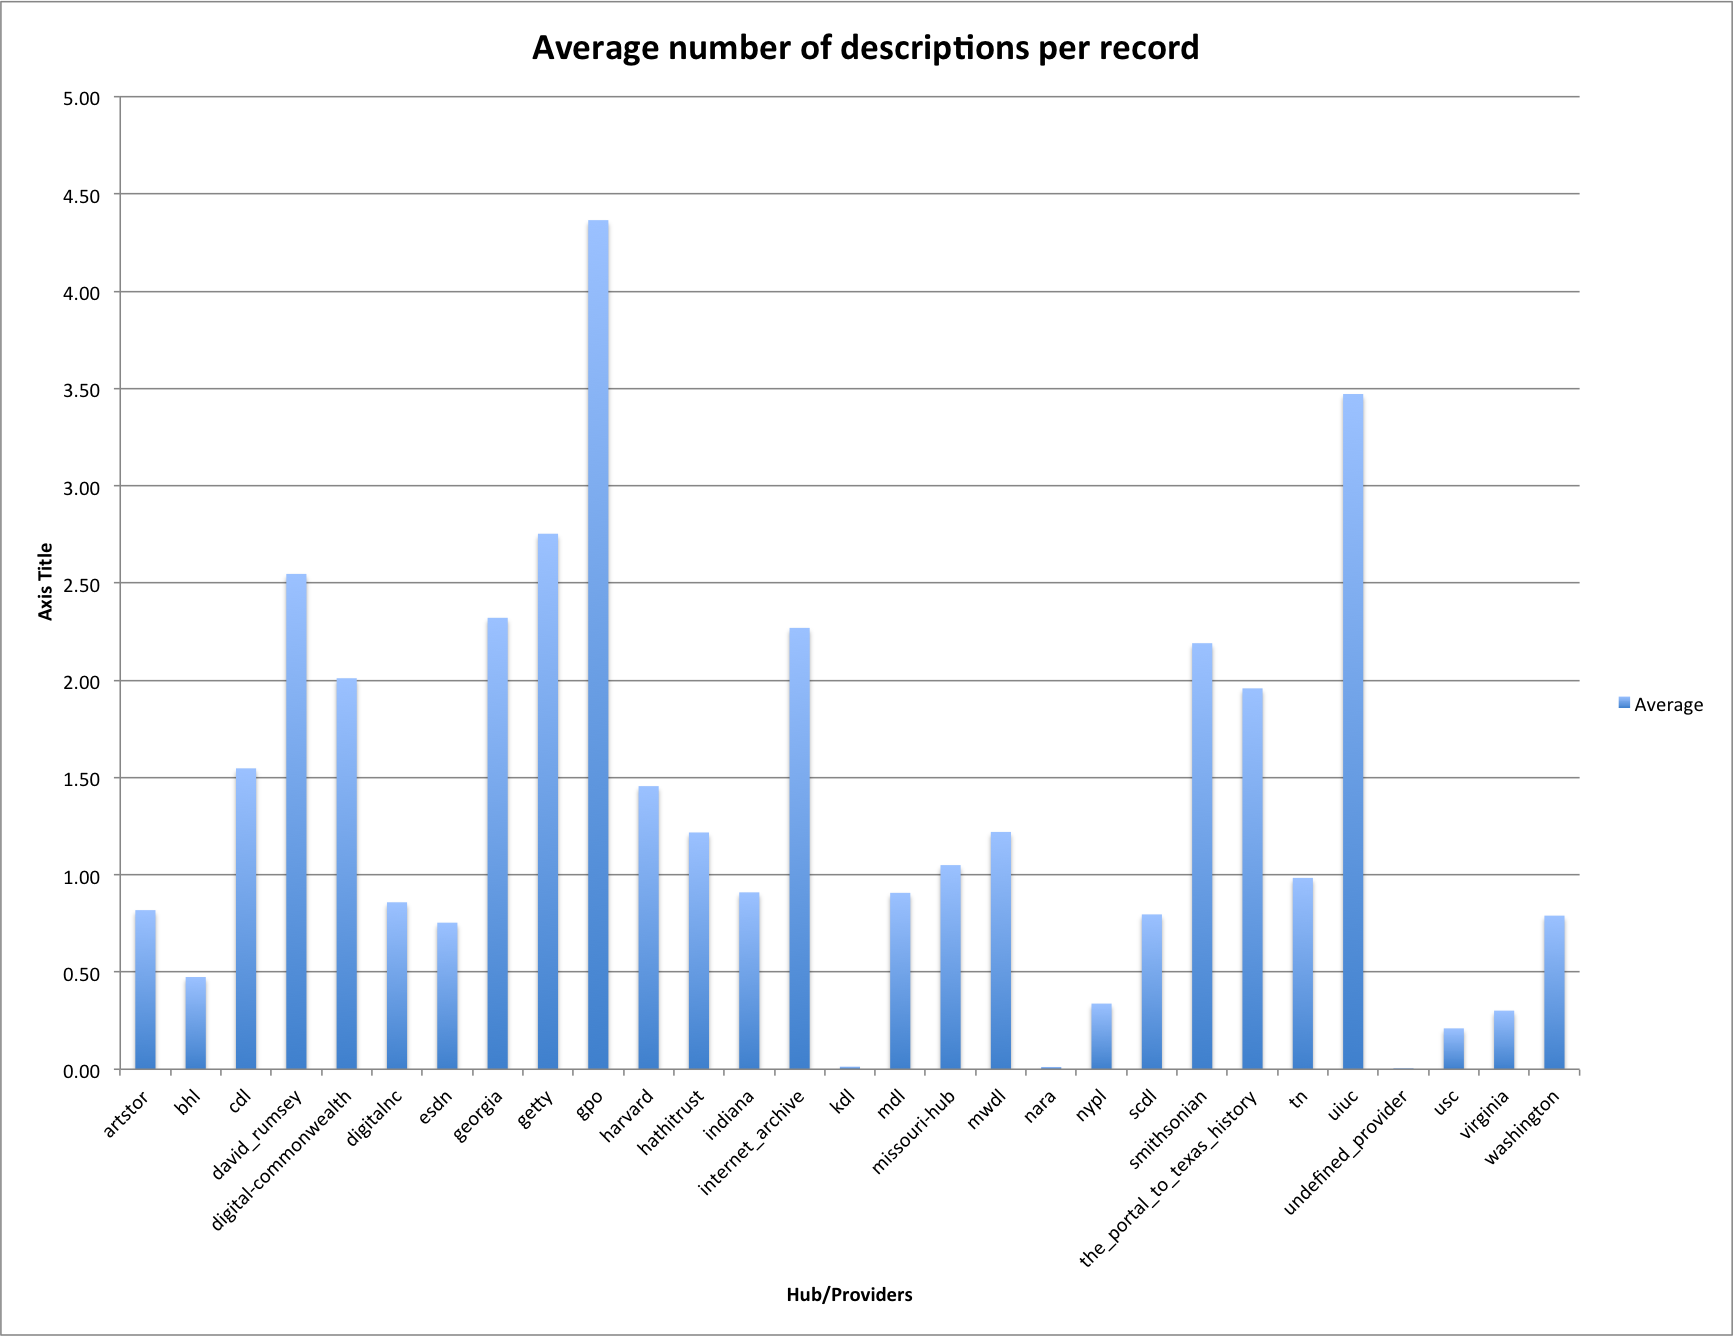
Average number of descriptions per record
You can see that there are several Hubs/Providers a have multiple descriptions per record, with the Government Publishing Office coming in at 4.37 descriptions per record.
I found it interesting that when you exclude the two Hubs/Providers that don’t really do descriptions (KDL and NARA) you see two that have a very low standard deviation from their mean (average) Tennessee Digital Library at 0.13 and The Portal to Texas History at 0.20 don’t drift much from their almost one description-per-record for Tennessee and almost two descriptions-per-record for Texas. It makes me think that this is probably a set of records that each of those Hubs/Providers would like to have identified so they could go in and add a few descriptions.
Closing
Well that wraps up this post that I hope is the first in a series of posts about the description field in the DPLA dataset. In subsequent posts we will move away from record level analysis of description fields and get down to the field level to do some analysis of the descriptions themselves. I have a number of predictions but I will hold onto those for now.
If you have questions or comments about this post, please let me know via Twitter.