Monthly Archives: May 2016

DPLA Description Fields: Language used in descriptions.

This is the last post in a series of posts related to the Description field found in the Digital Public Library of America.  I’ve been working with a collection of 11,654,800 metadata records for which I’ve created a dataset of 17,884,946 description fields.

This past Christmas I received a copy of Thing Explainer by Randall Munroe,  if you aren’t familiar with this book, Randall uses only the most used ten hundred words (thousand isn’t one of them) to describe very complicated concepts and technologies.

After seeing this book I started to wonder how much of the metadata we create for our digital objects use just the 1,000 most frequent words.  Often frequently used words, as well as less complex words (words with fewer syllables) are used in the calculation of the reading level of various texts so that also got me thinking about the reading level required to understand some of our metadata records.

Along that train of thought,  one of the things that we hear from aggregations of cultural heritage materials is that K-12 users are a target audience we have and that many of the resources we digitize are with them in mind.  With that being said, how often do we take them into account when we create our descriptive metadata?

When I was indexing the description fields I calculated three metrics related to this.

  1. What percentage of the tokens are in the 1,000 most frequently used English words
  2. What percentage of the tokens are in the 5,000 most frequently used English words
  3. What percentage of the tokens are words in a standard English dictionary.

From there I was curious about how the different providers compared to each other.

Average for 1,000, 5,000 and English Dictionary

1,000 most Frequent English Words

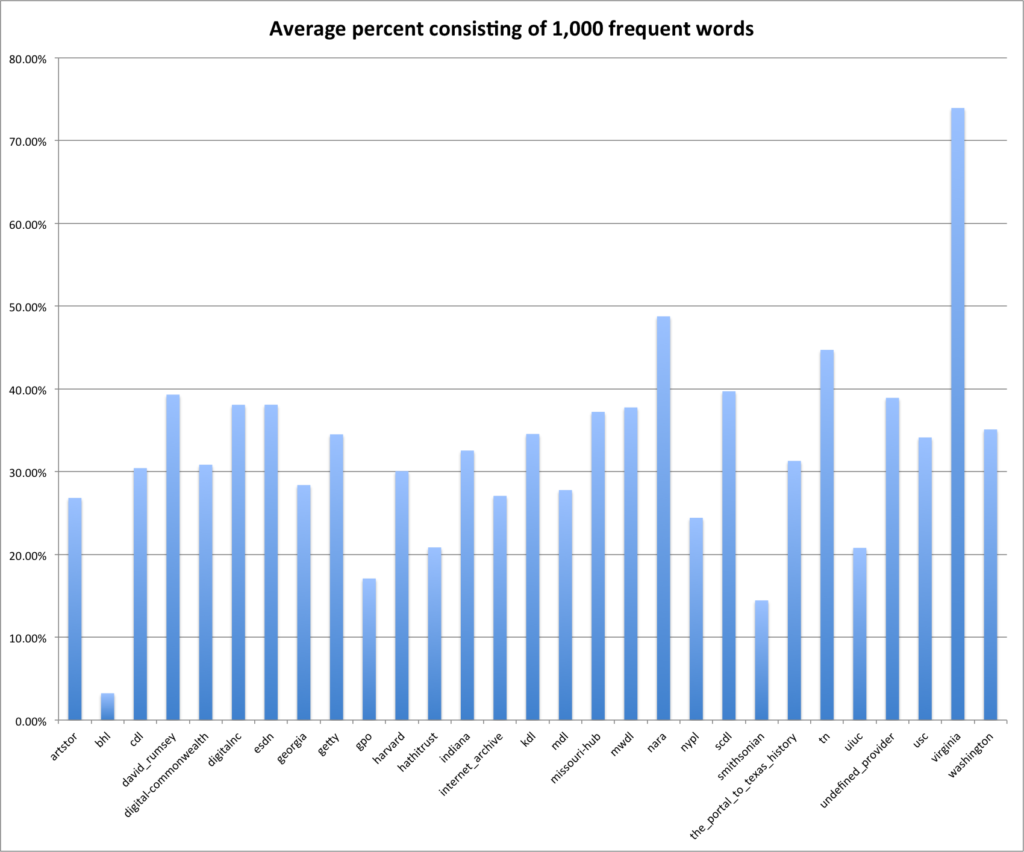
The first thing we will look at is the average of amount of a description composed of words from the list of the 1,000 most frequently used English words.

Average percentage of description consisting of 1000 most frequent English words.

Average percentage of description consisting of 1000 most frequent English words.

For me the providers/hubs that I notice are of course bhl that has very little usage of the 1,000 word vocabulary.  This is followed by smithsonian, gpo, hathitrust and uiuc.  On the other end of the scale is virginia that has an average of 70%.

5,000 most Frequent English Words

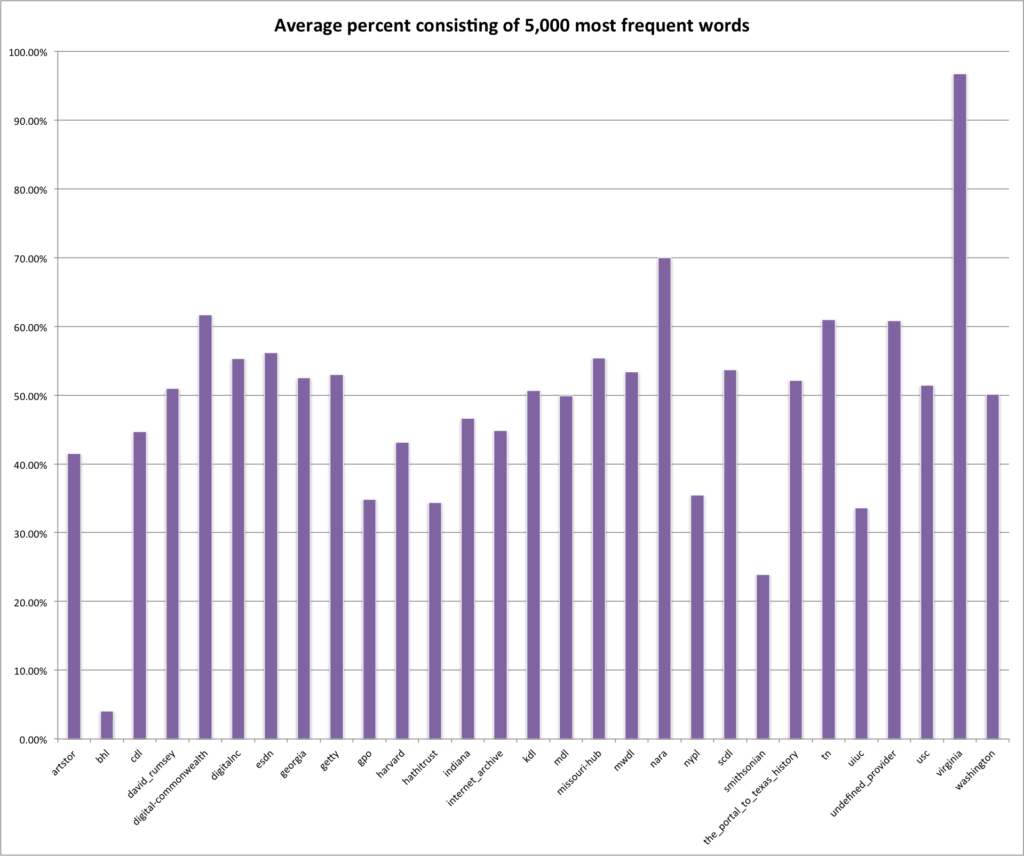
Next up is the average percentage of the descriptions that consist of words from the 5,000 most frequently used English words.

Average percentage of description consisting of 5000 most frequent English words.

Average percentage of description consisting of 5000 most frequent English words.

This graph ends up looking very much like the 1,000 words graph, just a bit higher percentage wise.  This is due to the fact of course that the 5,000 word list includes the 1,000 word list.  You do see a few changes in the ordering though,  for example gpo switches places with hathitrust in this graph over the 1,000 words graph above.

English Dictionary Words

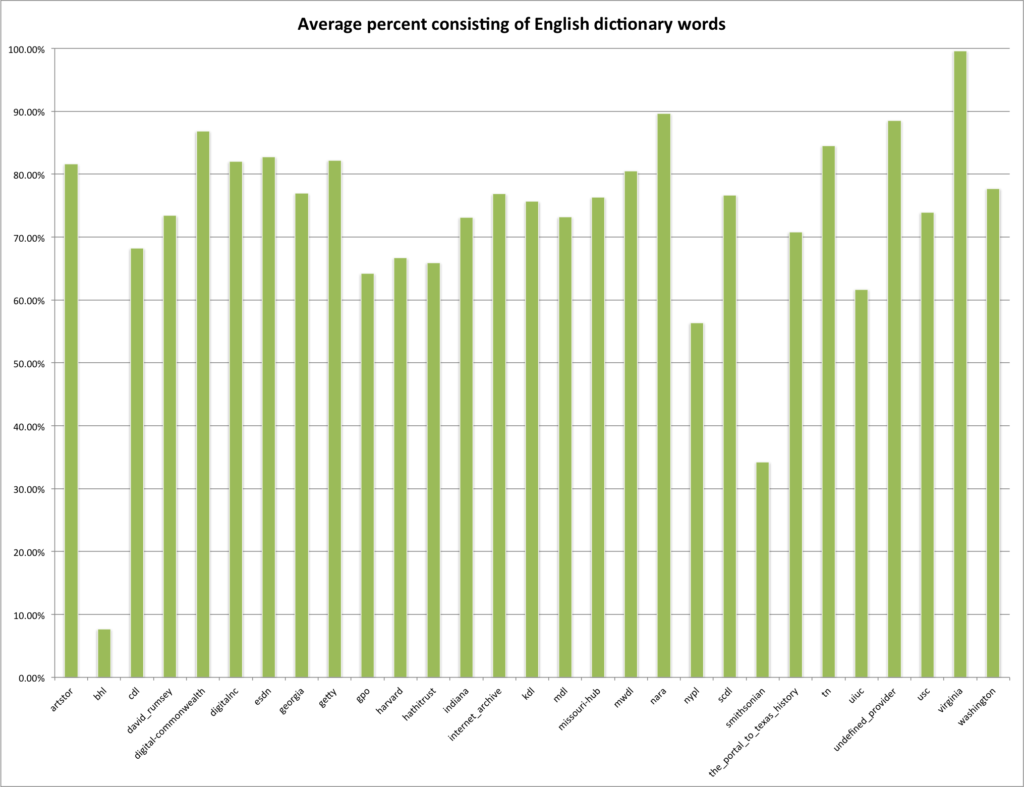
Next is the average percentage of descriptions that consist of words from a standard English dictionary.  Again this includes the 1,000 and 5,000 words in that dictionary so it will be even higher.

Average percentage of description consisting of English dictionary words.

Average percentage of description consisting of English dictionary words.

You see that the virginia hub has almost 100% or their descriptions consisting of English dictionary words.  The hubs that are the lowest in their use of English words for descriptions are bhl, smithsonian, and nypl.

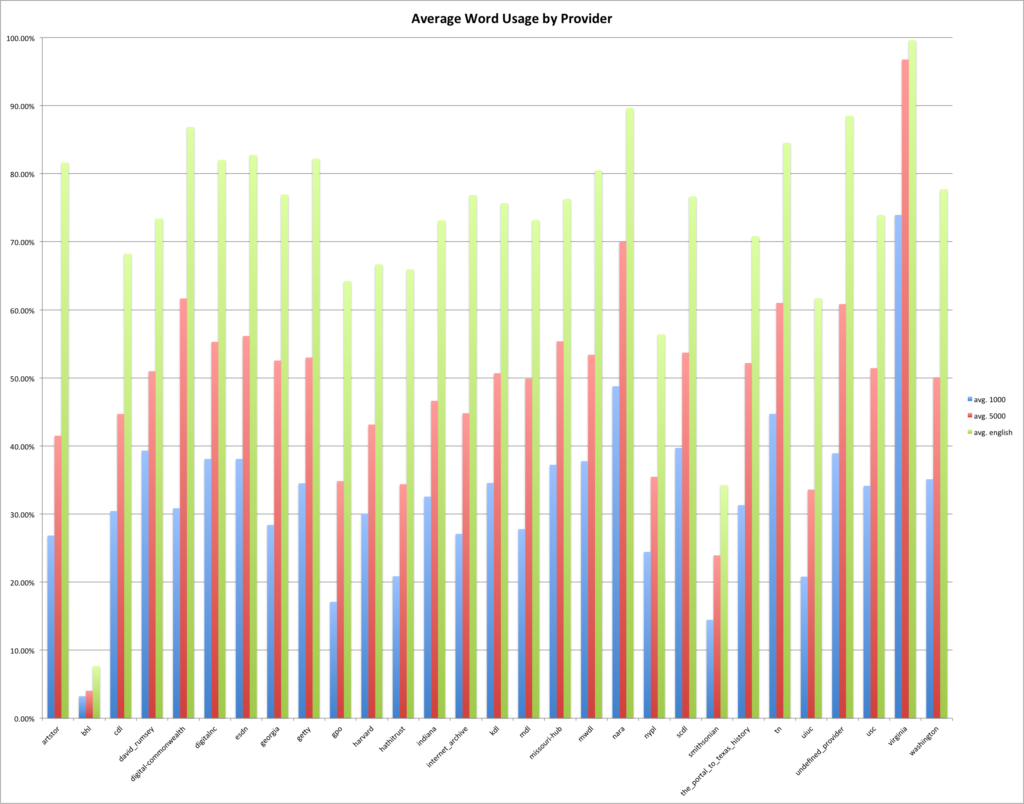
The graph below has 1,000, 5,000, and English Dictionary words grouped together for each provider/hub so you can see at a glance how they stack up.

1,000, 5,000 most frequent English words and English dictionary words by Provider

1,000, 5,000 most frequent English words and English dictionary words by Provider

Stacked Percent 1,000, 5,000, English Dictionary

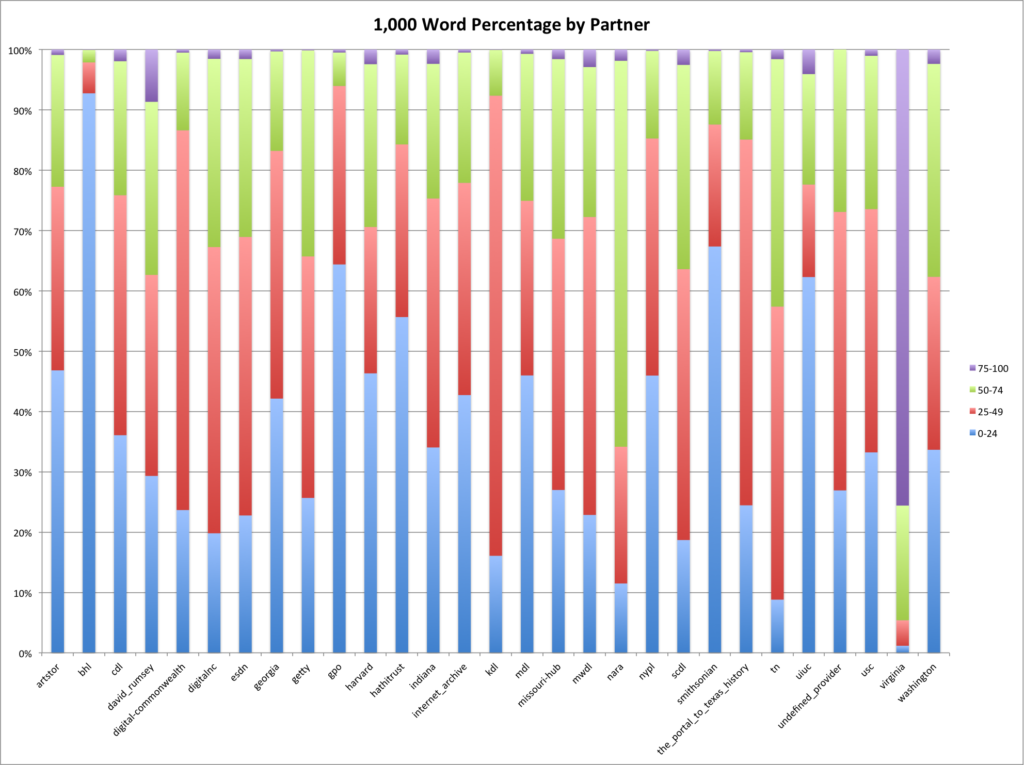
Next we will look at the percentages per provider/hub if we group the percentage utilization into 25% buckets.  This gives a more granular view of the data than just the averages presented above.

Percentage of descriptions by provider that use 1,000 most frequent English words.

Percentage of descriptions by provider that use 1,000 most frequent English words.

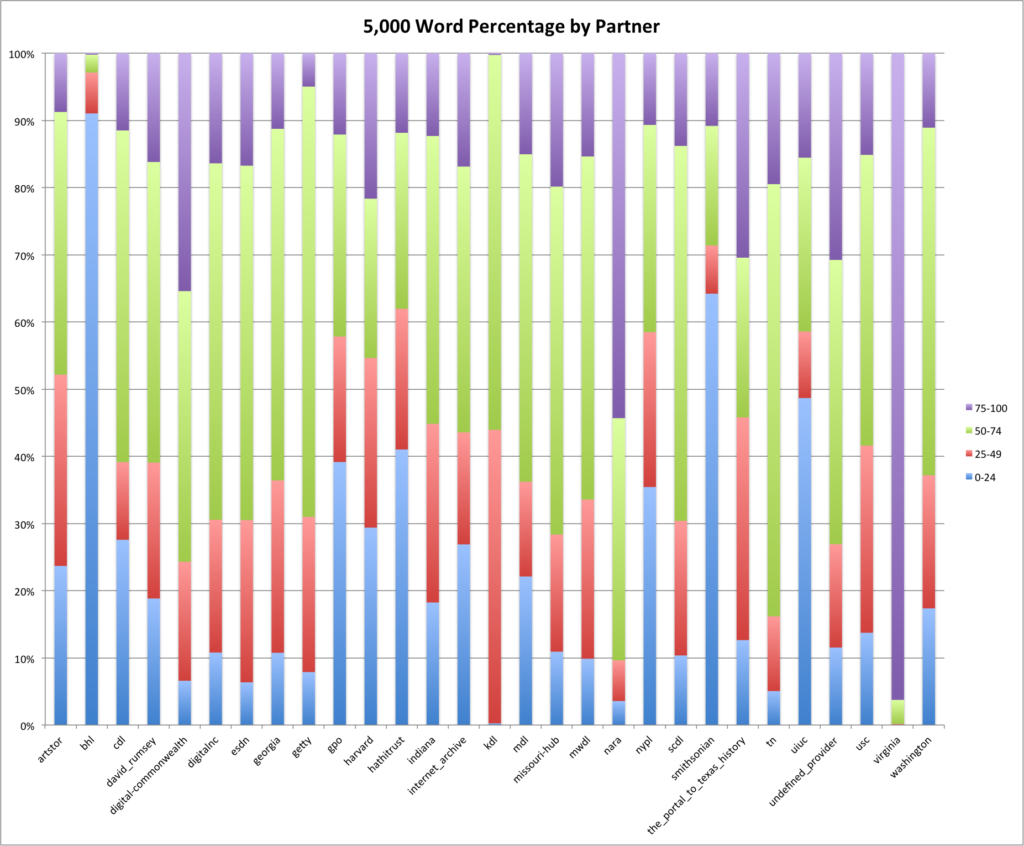
Percentage of descriptions by provider that use 5,000 most frequent English words.

Percentage of descriptions by provider that use 5,000 most frequent English words.

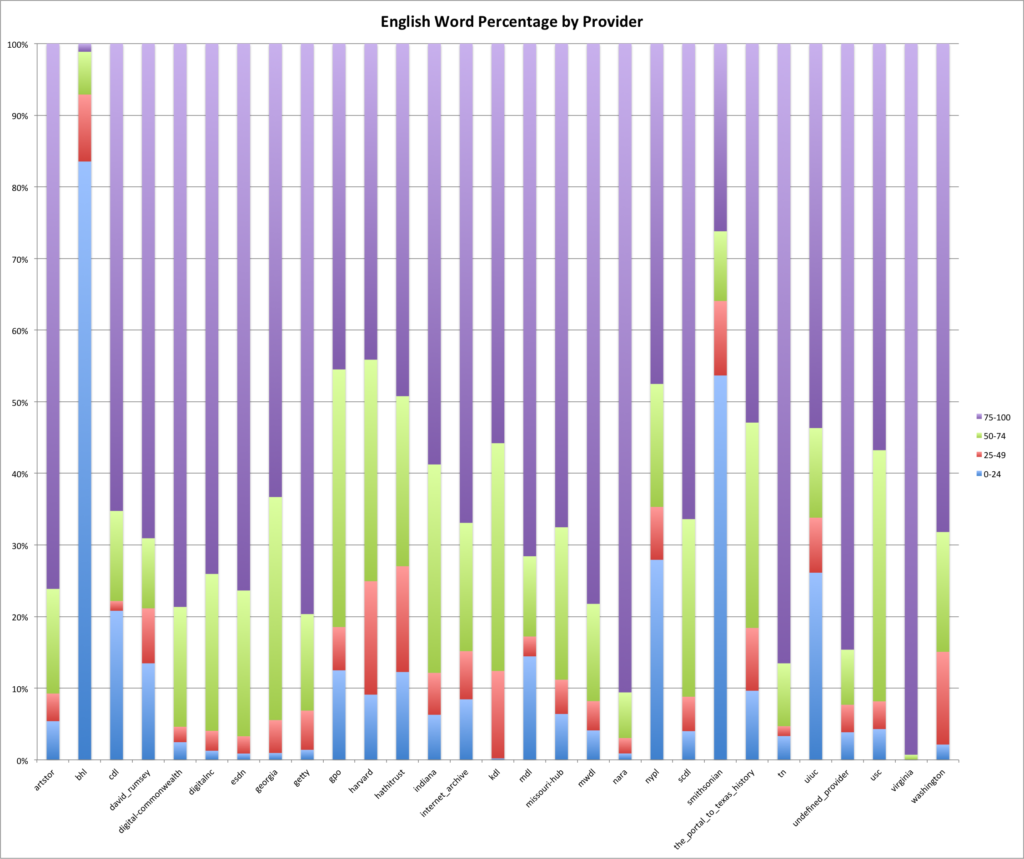
Percentage of descriptions by provider that use English dictionary words.

Percentage of descriptions by provider that use English dictionary words.

Closing

I don’t think it is that much of a stretch to draw parallels between the language used in our descriptions and the intended audience of our metadata records. How often are we writing metadata records for ourselves instead of our users?  A great example that comes to mind is “verso” or “recto” that we use often for “front” and “back” of items. In the dataset I’ve been using there are 56,640 descriptions with the term “verso” and 5,938 with the term “recto”.

I think we should be taking into account our various audiences when we are creating metadata records.  I know this sounds like a very obvious suggestion but I don’t think we really do that when we are creating our descriptive metadata records.  Is there a target reading level for metadata records? Should there be?

Looking at the description fields in the DPLA dataset has been interesting.  The kind of analysis that I’ve done so far can be seen as kind of a distant reading of these fields. Big round numbers that are pretty squishy and only show the general shape of the field.  To dive in and do a close reading of the metadata records is probably needed to better understand what is going on in these records.

Based on experience of mapping descriptive metadata into the Dublin Core metadata fields, I have a feeling that the description field is generally a dumping ground for information that many of us might not consider “description”.  I sometimes wonder if it would do our users a greater service by adding a true “note” field to our metadata models so that we have a proper location to dump “notes and other stuff” instead of muddying up a field that should have an obvious purpose.

That’s about it for this work with descriptions,  or at least it is until I find some interest in really diving deeper into the data.

If you have questions or comments about this post,  please let me know via Twitter.
DPLA Description Fields: More statistics (so many graphs)

In the past few posts we looked at the length of the description fields in the DPLA dataset as a whole and at the provider/hub level.

The length of the description field isn’t the only field that was indexed for this work.  In fact I indexed on a variety of different values for each of the descriptions in the dataset.

Below are the fields I currently am working with.

Field Indexed Value Example
dpla_id 11fb82a0f458b69cf2e7658d8269f179
id 11fb82a0f458b69cf2e7658d8269f179_01
provider_s usc
desc_order_i 1
description_t A corner view of the Santa Monica City Hall.; Streetscape. Horizontal photography.
desc_length_i 82
tokens_ss “A”, “corner”, “view”, “of”, “the”, “Santa”, “Monica”, “City”, “Hall”, “Streetscape”, “Horizontal”, “photography”
token_count_i 12
average_token_length_f 5.5833335
percent_int_f 0
percent_punct_f 0.048780486
percent_letters_f 0.81707317
percent_printable_f 1
percent_special_char_f 0
token_capitalized_f 0.5833333
token_lowercased_f 0.41666666
percent_1000_f 0.5
non_1000_words_ss “santa”, “monica”, “hall”, “streetscape”, “horizontal”, “photography”
percent_5000_f 0.6666667
non_5000_words_ss “santa”, “monica”, “streetscape”, “horizontal”
percent_en_dict_f 0.8333333
non_english_words_ss “monica”, “streetscape”
percent_stopwords_f 0.25
has_url_b FALSE

This post will try and pull together some of the data from the different fields listed above and present them in a way that we will hopefully be able to use to derive some meaning from.

More Description Length Discussion

In the previous posts I’ve primarily focused on the length of the description fields.  There are two other fields that I’ve indexed that are related to the length of the description fields.  These two fields include the number of tokens in a description and the average token length of fields.

I’ve included those values below.  I’ve included two mean values, one for all of the descriptions in the dataset (17,884,946 descriptions) and in the other the descriptions that are 1 character in length or more (13,771,105descriptions).

Field Mean – Total Mean – 1+ length
desc_length_i 83.321 108.211
token_count_i 13.346 17.333
average_token_length_f 3.866 5.020

The graphs below are based on the numbers of just descriptions that are 1+ length or more.

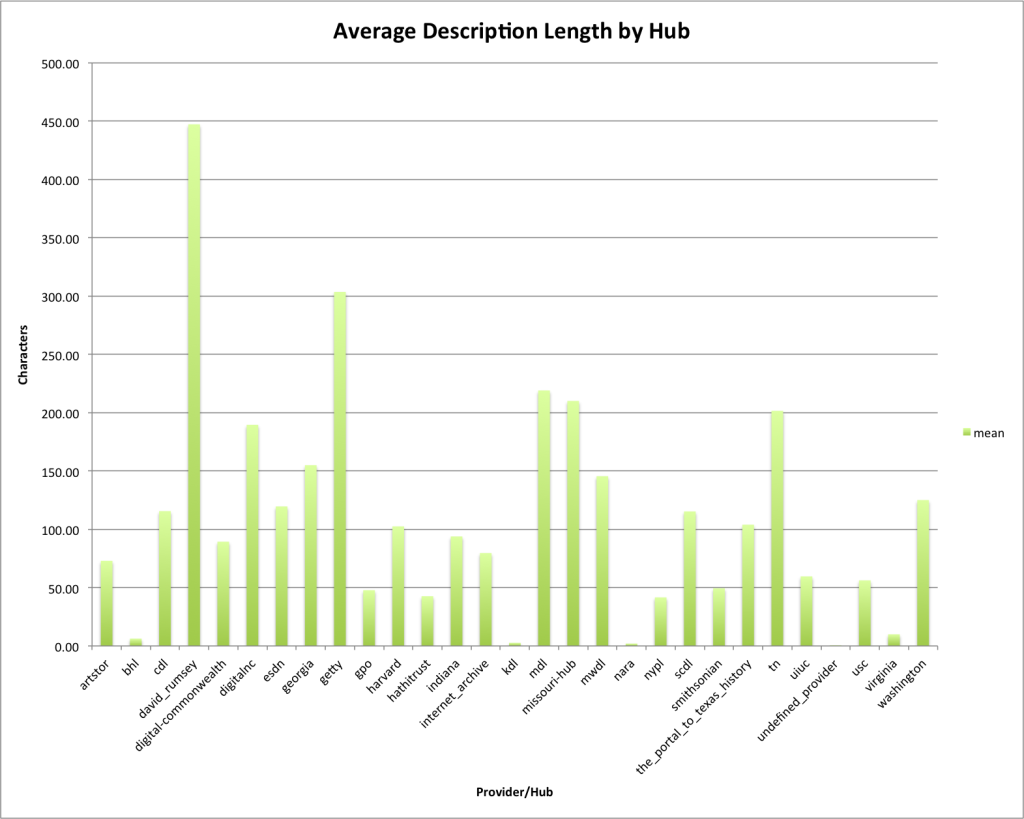
This first graph is being reused from a previous post that shows the average length of description by Provider/Hub.  David Rumsey and the Getty are the two that average over 250 characters per description.

Average Description Length by Hub

Average Description Length by Hub

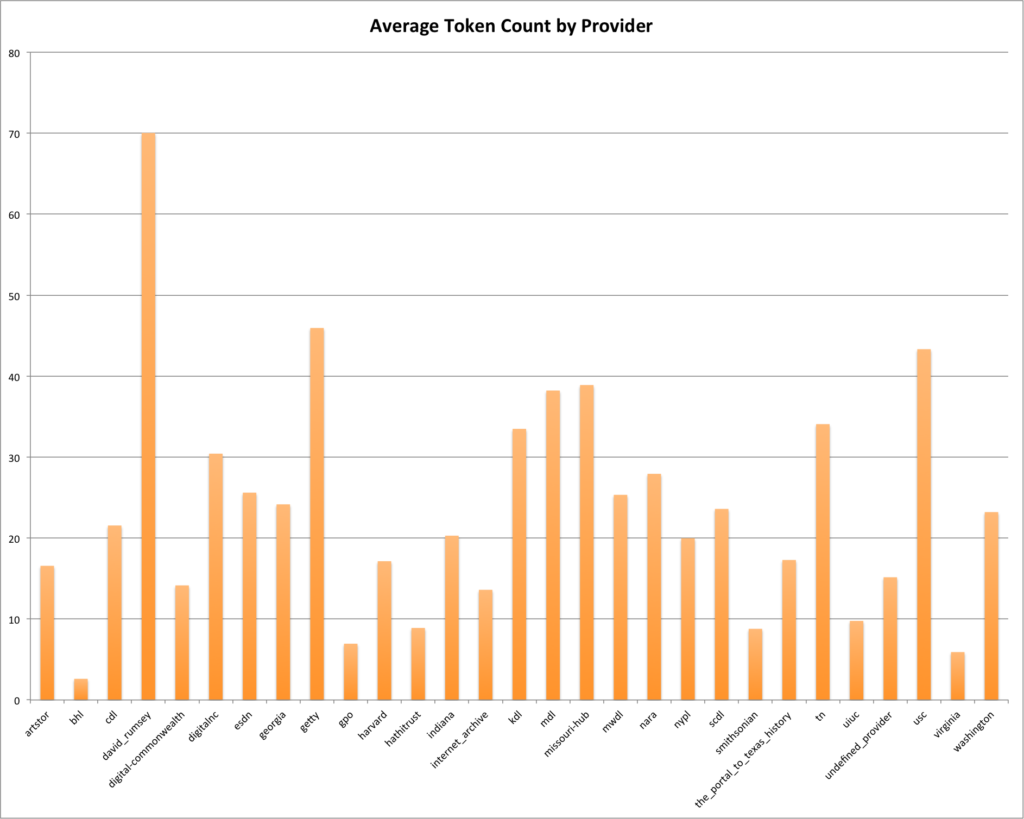
It shouldn’t surprise you that David Ramsey and Getter are two of the Providers/Hubs that have the highest average token counts,  with longer descriptions generally creating more tokens. There are a few differences that don’t match this though,  USC that has an average of just over 50 characters for the average description length comes in as the third highest in the average token counts at over 40 tokens per description.  There are a few other providers/hubs that look a bit different than their average description length.

Average Token Count by Provider

Average Token Count by Provider

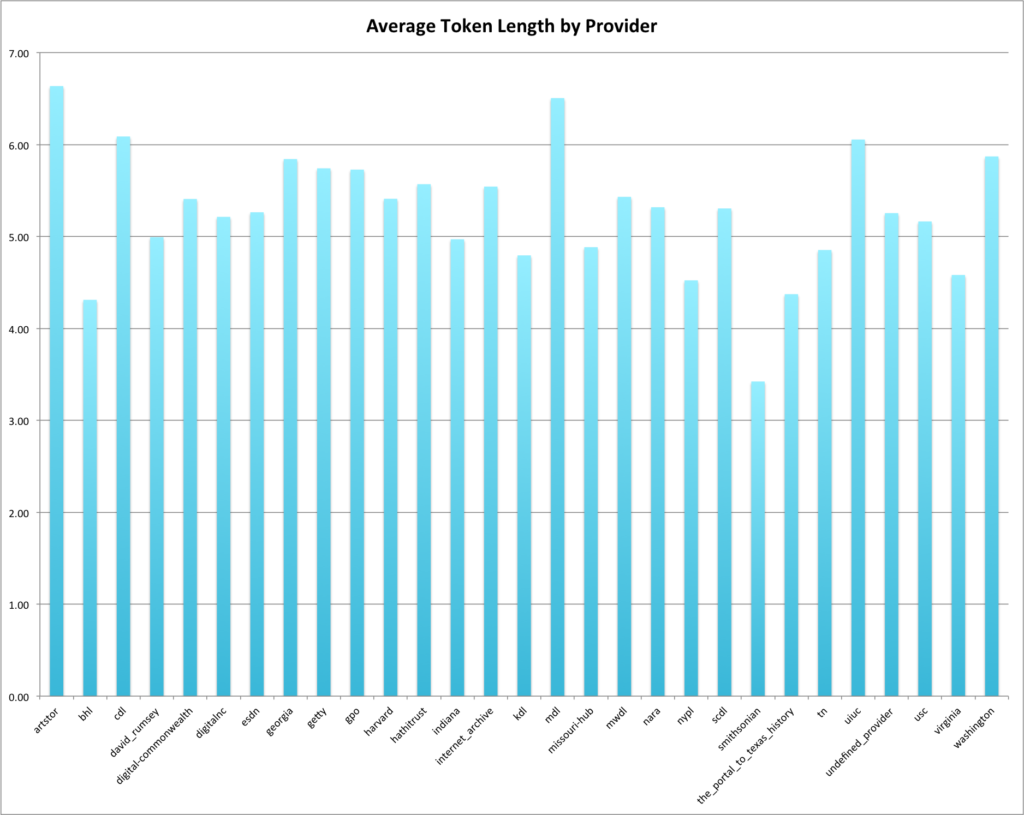
Below is a graph of the average token lengths by providers.  The lower the number is the lower average length of a token.  The mean for the entire DPLA dataset for descriptions of length 1+ is just over 5 characters.

Average Token Length by Provider

Average Token Length by Provider

That’s all I have to say about the various statistics related to length for this post.  I swear!. Next we move on to some of the other metrics that I calculated when indexing things.

Other Metrics for the Description Field

Throughout this analysis I had a question of when to take into account that there were millions of records in the dataset that had no description present.  I couldn’t just throw away that fact in the analysis but I didn’t know exactly what to do with them.  So below I present statistics for the average of many of the fields I indexed as both the mean of all of the descriptions and then the mean of just the descriptions that are one or more characters in length.  The graphs that follow the table below are all based on the subset of descriptions that are greater than or equal to one character in length.

Field Mean – Total Mean – 1+ length
percent_int_f 12.368% 16.063%
percent_punct_f 4.420% 5.741%
percent_letters_f 50.730% 65.885%
percent_printable_f 76.869% 99.832%
percent_special_char_f 0.129% 0.168%
token_capitalized_f 26.603% 34.550%
token_lowercased_f 32.112% 41.705%
percent_1000_f 19.516% 25.345%
percent_5000_f 31.591% 41.028%
percent_en_dict_f 49.539% 64.338%
percent_stopwords_f 12.749% 16.557%

Stopwords

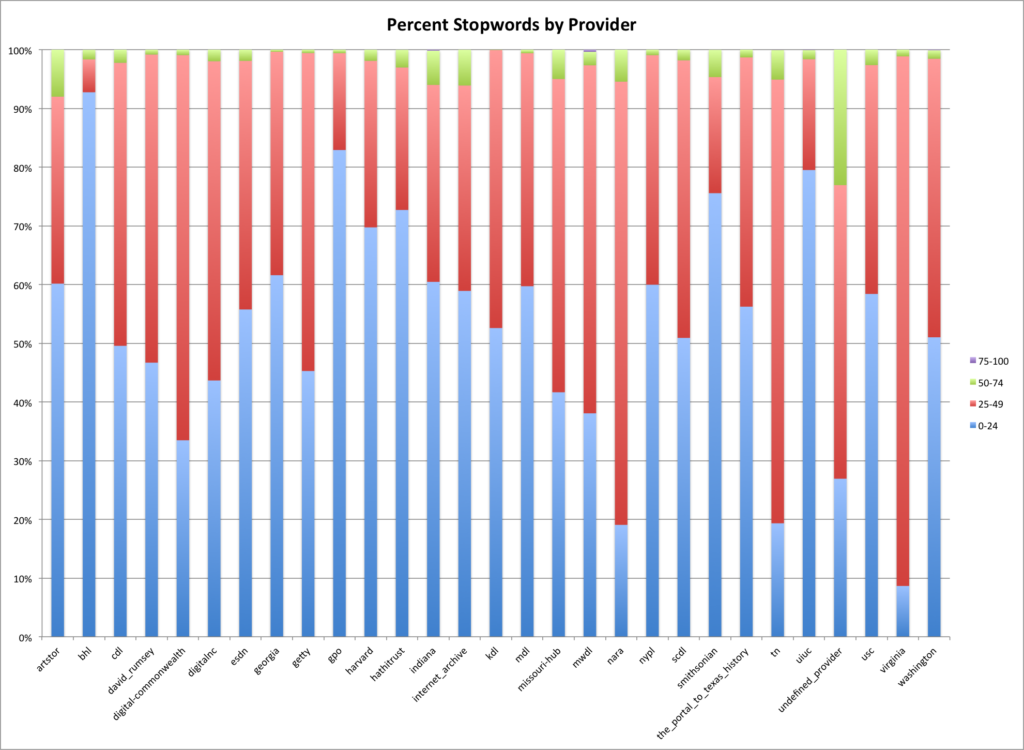
Stopwords are words that occur very commonly in natural language.  I used a list of 127 stopwords for this work to help understand what percentage of a description (based on tokens) is made up of stopwords.  While stopwords generally carry little meaning for natural language, they are a good indicator of natural language,  so providers/hubs that have a higher percentage of stopwords would probably have more descriptions that resemble natural language.

Percent Stopwords by Provider

Percent Stopwords by Provider

Punctuation

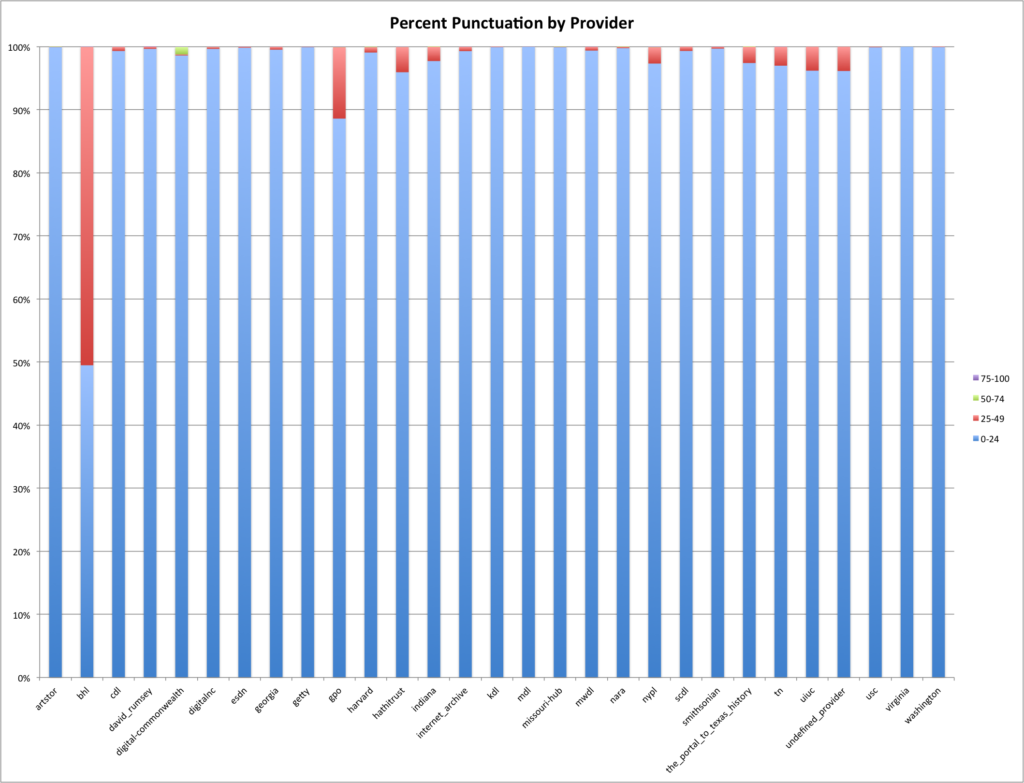
I was curious about how much punctuation was present in a description on average.  I used the following characters as my set of “punctuation characters”

!"#$%&'()*+,-./:;<=>?@[\]^_`{|}~

I found the number of characters in a description that were made up of these characters vs other characters and then divided the number of punctuation characters by the total description length to get the percentage of the description that is punctuation.

Percent Punctuation by Provider

Percent Punctuation by Provider

Punctuation is common in natural language but it occurs relatively infrequently. For example that last sentence was eighty characters long and only one of them was punctuation (the period at the end of the sentence). That comes to a percent_punctuation of only 1.25%.  In the graph above you will see the the bhl provider/hub has over 50% of their description with 25-49% punctuation.  That’s very high when compared to the other hubs and the fact that there is an average of about 5% overall for the DPLA dataset. Digital Commonwealth has a percentage of descriptions that are from 50-74% punctuation which is pretty interesting as well.

Integers

Next up in our list of things to look at is the percentage of the description field that consists of integers.  For review,  integers are digits,  like the following.

0123456789

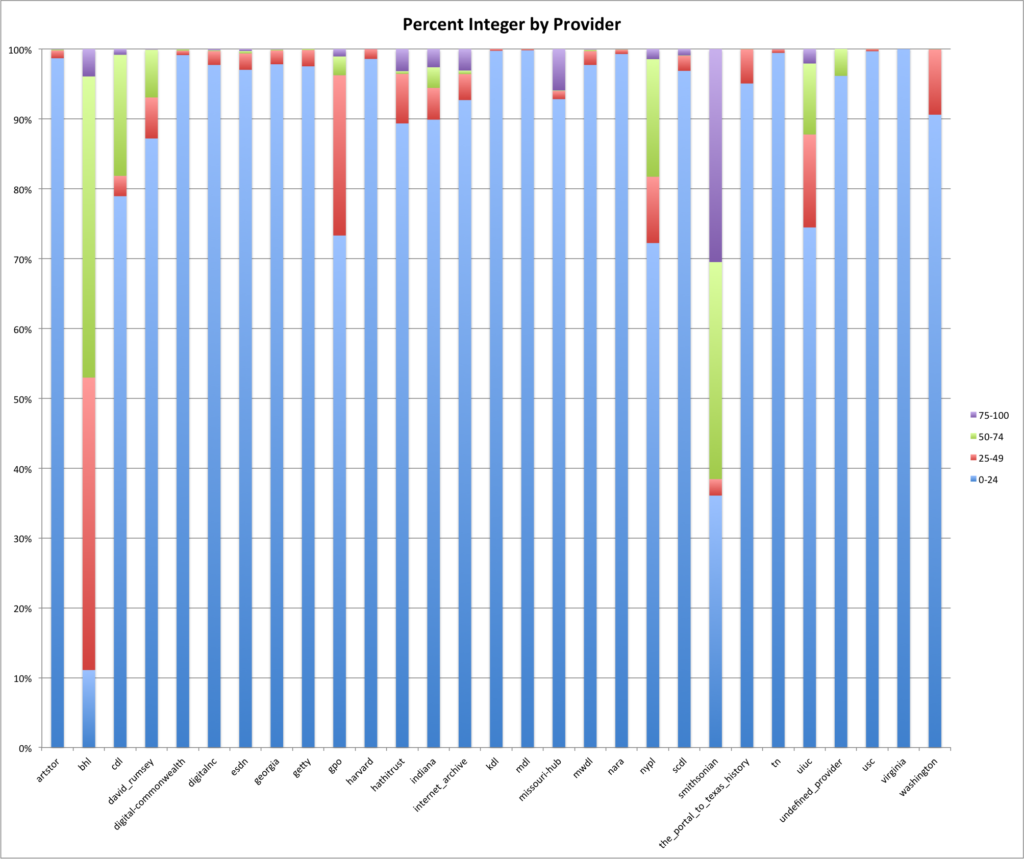
I used the same process for the percent integer as I did for the percent punctuation mentioned above.

Percent Integer by Provider

Percent Integer by Provider

You can see that there are several providers/hubs that have quite a high percentage integer for their descriptions.  These providers/hubs are the bhl and the smithsonian.  The smithsonian has over 70% of its descriptions with percent integers of over 70%.

Letters

Once we’ve looked at punctuation and integers,  that leaves really just letters of the alphabet to makeup the rest of a description field.

That’s exactly what we will look at next. For this I used the following characters to define letters.

abcdefghijklmnopqrstuvwxyzABCDEFGHIJKLMNOPQRSTUVWXYZ

I didn’t perform any case folding so letters with diacritics wouldn’t be counted as letters in this analysis,  but we will look at those a little bit later.

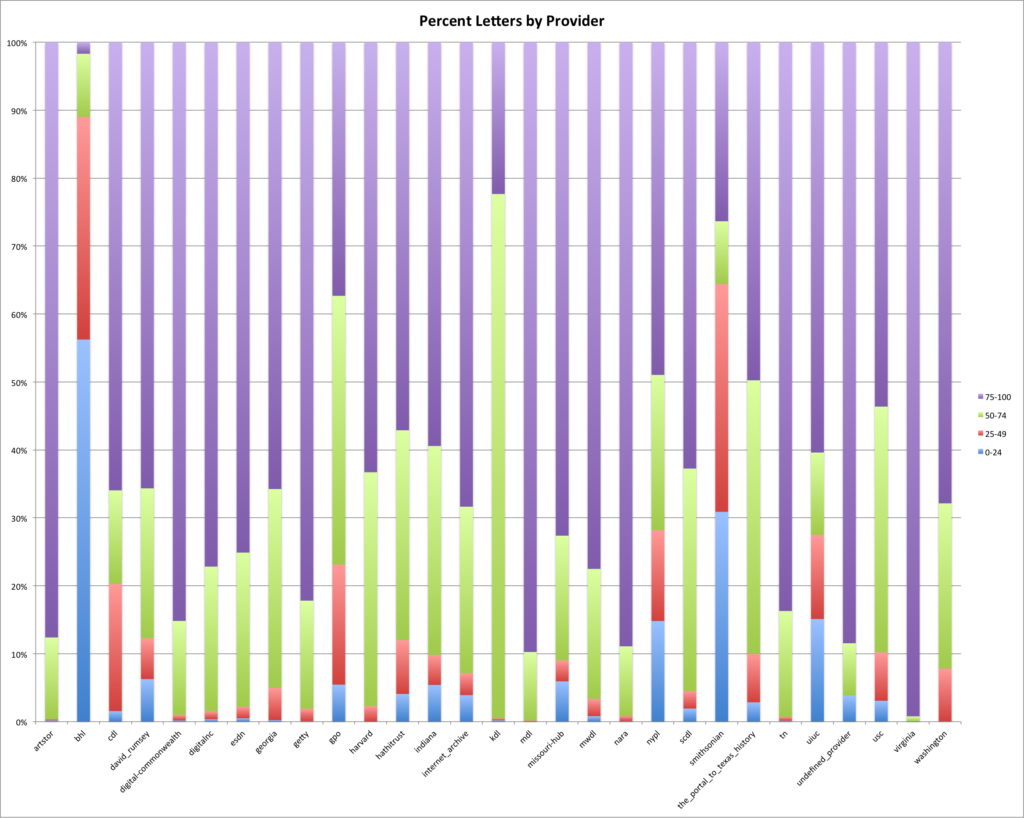
Percent Letter by Provider

Percent Letter by Provider

For percent letters you would expect there to be a very high percentage of the descriptions that themselves contain a high percentage of letters in the description.  Generally this appears to be true but there are some odd providers/hubs again mainly bhl and the smithsonian,  though nypl, kdl and gpo also seem to have a different distribution of letters than others in the dataset.

Special Characters

The next thing to look at was the percentage of “special characters” used in a description.  For this I used the following definition of “special character”.  If a character is not present in the following list of characters (which also includes whitespace characters) then it is considered to be a “special character”

0123456789abcdefghijklmnopqrstuvwxyzABCDEFGHIJKLMNOPQRSTUVWXYZ
!"#$%&'()*+,-./:;<=>?@[\]^_`{|}~  
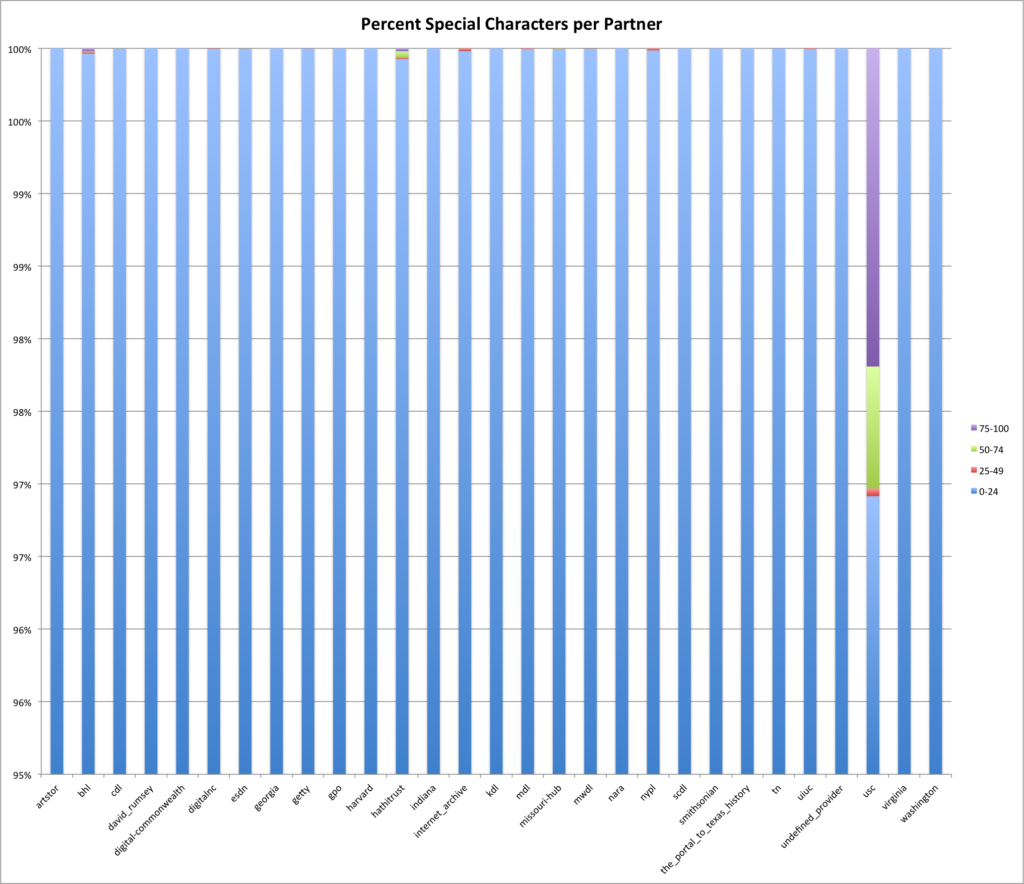
Percent Special Character by Provider

Percent Special Character by Provider

A note in reading the graph above,  keep in mind that the y-axis is only 95-100% so while USC looks different here it only represents 3% of its descriptions that have 50-100% of the description being special characters.  Most likely a set of descriptions that have metadata created in a non-english language.

URLs

The final graph I want to look at in this post is the percentage of descriptions for a provider/hub that has a URL present in its description.  I used the presence of either http:// or https:// in the description to define if it does or doesn’t have a URL present.

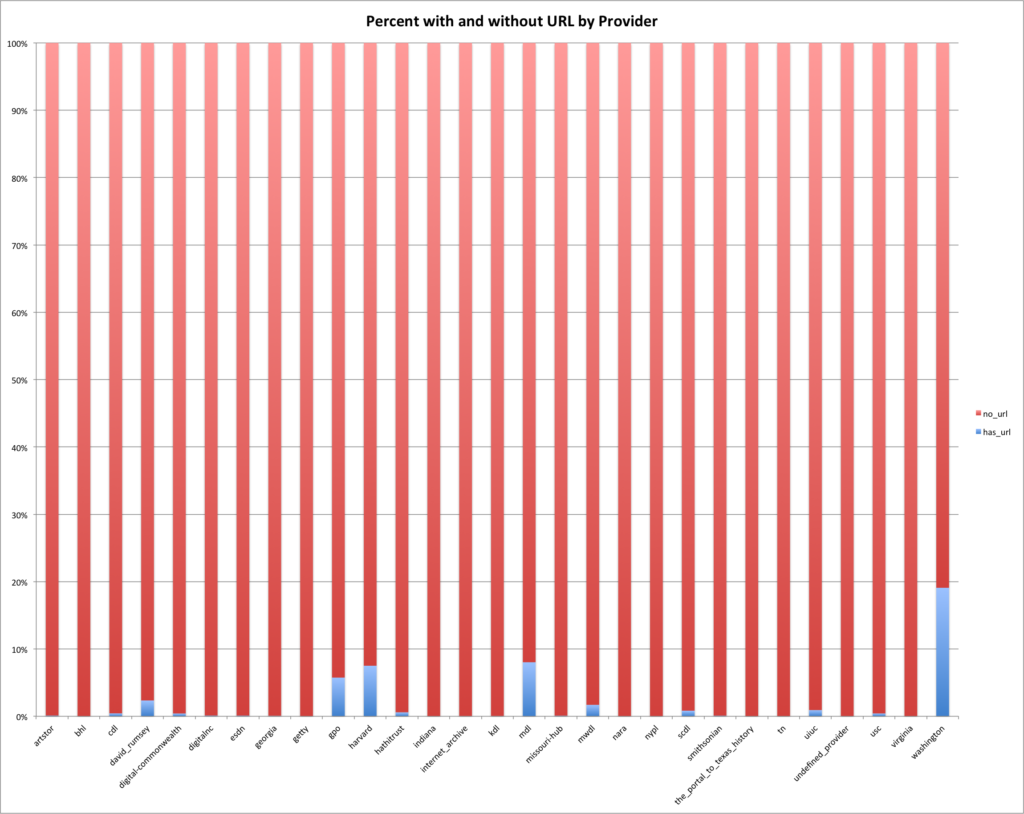
Percent URL by Provider

Percent URL by Provider

The majority providers/hubs don’t have URLs in their descriptions with a few obvious exceptions.  The provider/hubs of washington, mwdl, harvard, gpo and david_ramsey do have a reasonable number of descriptions with URLs with washington leading with almost 20% of their descriptions having a URL present.

Again this analysis is just looking at what high-level information about the descriptions can tell us.  The only metric we’ve looked at that actually goes into the content of the description field to pull out a little bit of meaning is the percent stopwords.  I have one more post in this series before we wrap things up and then we will leave descriptions in the DPLA along for a bit.

If you have questions or comments about this post,  please let me know via Twitter.