Monthly Archives: June 2016

Comparing Web Archives: EOT2008 and EOT2012 – Curator Intent

This is another post in a series that I’ve been doing to compare the End of Term Web Archives from 2008 and 2012.  If you look back a few posts in this blog you will see some other analysis that I’ve done with the datasets so far.

One thing that I am interested in understanding is how well the group that conducted the EOT crawls did in relation to what I’m calling “curator intent”.  For both the EOT archives suggested seeds were collected using instances of the URL Nomination Tool hosted by the UNT Libraries. A combination of bulk lists of seeds URLs collected by various institutions and individuals were combined individual nominations made by users of the nomination tool.  The resulting lists were used as seed lists for the crawlers that were used to harvest the EOT archives.  In 2008 there were four institutions that crawled content,  the Internet Archive (IA), Library of Congress (LOC), California Digital Library (CDL), and the UNT Libraries (UNT).  In 2012 CDL was not able to do any crawling so just IA, LOC and UNT crawled.  UNT and LOC had limited scope in what they were interested in crawling while CDL and IA took the entire seed list and used that to feed their crawlers.  The crawlers were scoped very wide so that they would get as much content as they could, so the nomination seeds were used as starting places and we allowed the crawlers to go to all subdomains and paths on those sites as well as to areas that the sites linked to on other domains.

During the capture period there wasn’t consistent quality control performed for the crawls, we accepted what we could get and went on with our business.

Looking back at the crawling that we did I was curious of two things.

  1. How many of the domain names from the nomination tool were not present in the EOT archive.
  2. How many domains from .gov and .mil were captured but not explicitly nominated.

EOT2008 Nominated vs Captured Domains.

In the 2008 nominated URL list form the URL Nomination Tool there were a total of 1,252 domains with 1,194 being either .gov or .mil.  In the EOT2008 archive there were a total of 87,889 domains and 1,647 of those were either .gov or .mil.

There are 943 domains that are present in both the 2008 nomination list and the EOT2008 archive.  There are 251 .gov or .mil domains from the nomination list that were not present in the EOT2008 archive. There are 704 .gov or .mil domains that are present in the EOT2008 archive but that aren’t present in the 2008 nomination list.

Below is a chart showing the nominated vs captured for the .gov and .mil

2008 .gov and .mil Nominated and Archived

2008 .gov and .mil Nominated and Archived

Of those 704 domains that were captured but never nominated, here are the thirty most prolific.

Domain URLs
womenshealth.gov 168,559
dccourts.gov 161,289
acquisition.gov 102,568
america.gov 89,610
cfo.gov 83,846
kingcounty.gov 61,069
pa.gov 42,955
dc.gov 28,839
inl.gov 23,881
nationalservice.gov 22,096
defenseimagery.mil 21,922
recovery.gov 17,601
wa.gov 14,259
louisiana.gov 12,942
mo.gov 12,570
ky.gov 11,668
delaware.gov 10,124
michigan.gov 9,322
invasivespeciesinfo.gov 8,566
virginia.gov 8,520
alabama.gov 6,709
ct.gov 6,498
idaho.gov 6,046
ri.gov 5,810
kansas.gov 5,672
vermont.gov 5,504
arkansas.gov 5,424
wi.gov 4,938
illinois.gov 4,322
maine.gov 3,956

I see quite a few state and local governments that have a .gov domain which was out of scope of the EOT project but there are also a number of legitimate domains in the list that were never nominated.

EOT2012 Nominated vs Captured Domains.

In the 2012 nominated URL list form the URL Nomination Tool there were a total of 1,674 domains with 1,551 of those being .gov or .mil domains.  In the EOT2012 archive there were a total of 186,214 domains and 1,944 of those were either .gov or .mil.

There are 1,343 domains that are present in both the 2008 nomination list and the EOT2012 archive.  There are 208 .gov or .mil domains from the nomination list that were not present in the EOT2012 archive. There are 601 .gov or .mil domains that are present in the EOT2012 archive but that aren’t present in the 2012 nomination list.

Below is a chart showing the nominated vs captured for the .gov and .mil

2012 .gov and .mil Domains Nominated and Archived

2012 .gov and .mil Domains Nominated and Archived

Of those 601 domains that were captured but never nominated, here are the thirty most prolific.

Domain URLs
gao.gov 952,654
vaccines.mil 856,188
esgr.mil 212,741
fdlp.gov 156,499
copyright.gov 70,281
congress.gov 40,338
openworld.gov 31,929
americaslibrary.gov 18,415
digitalpreservation.gov 17,327
majorityleader.gov 15,931
sanjoseca.gov 10,830
utah.gov 9,387
dc.gov 9,063
nyc.gov 8,707
ng.mil 8,199
ny.gov 8,185
wa.gov 8,126
in.gov 8,011
vermont.gov 7,683
maryland.gov 7,612
medicalmuseum.mil 7,135
usbg.gov 6,724
virginia.gov 6,437
wv.gov 6,188
compliance.gov 6,181
mo.gov 6,030
idaho.gov 5,880
nv.gov 5,709
ct.gov 5,628
ne.gov 5,414

Again there are a number of state and local government domains present in the list but up at the top we see quite a few URLs harvested from domains that are federal in nature and would fit into the collection scope for the EOT project.

How did we do?

The way that seed lists for the nomination tool were collected for the EOT2008 and EOT2012 nomination lists introduced a bit of dirty data.  We would need to look a little deeper to see what the issues were with these. Some things that come to mind are that we got seeds from domains that existed prior to 2008 or 2012 but that didn’t exist when we were harvesting.  Also there could have been typos in the URLs that were nominated so we never grabbed the suggested content.  We might want to introduce a validate process for the nomination tool that let’s us know what that status of a URL in a project is at a given point so that we can at least have some sort of record.


13% to 10%

Comparing Web Archives: EOT2008 and EOT2012 – What disappeared

This is the fourth post in a series that looks at the End of Term Web Archives captured in 2008 and 2012.  In previous posts I’ve looked at the when, what, and where of these archives.  In doing so I pulled together the domain names from each of the archives to compare them.

My thought was that I could look at which domains had content in the EOT2008 or EOT2012 and compare these domains to get some very high level idea of what content was around in 2008 but was completely gone in 2012.  Likewise I could look at new content domains that appeared since 2008.  For this post I’m limiting my view to just the domains that end in .gov or .mil because they are generally the focus of these web archiving projects.

Comparing EOT2008 and EOT2012

The are 1,647 unique domain names in the EOT2008 archive and 1,944 unique domain names in the EOT2012 archive, which is an increase of 18%. Between the two archives there are 1,236 domain names that are common.  There are 411 domains that exist in the EOT2008 that are not present in EOT2012, and 708 new domains in EOT2012 that didn’t exist in EOT2008.

Domains in EOT2008 and E0T2012

Domains in EOT2008 and E0T2012

The EOT2008 dataset consists of 160,212,141 URIs and the EOT2012 dataset comes in at 194,066,940 URIs.  When you look at the URLs in the 411 domains that are present in EOT2008 and missing in EOT2012 you get 3,784,308 which is just 2% of the total number of URLs.  When you look at the EOT2012 domains that were only present in 2012 compared to 2008 you see 5,562,840 URLs (3%) that were harvested from domains that only existed in the EOT2012 archive.

The thirty domains with the most URLs captured for them that were present in the EOT2008 collection that weren’t present in EOT2012 are listed in the table below.

Domain Count
geodata.gov 812,524
nifl.gov 504,910
stat-usa.gov 398,961
tradestatsexpress.gov 243,729
arnet.gov 174,057
acqnet.gov 171,493
dccourts.gov 161,289
web-services.gov 137,202
metrokc.gov 132,210
sdi.gov 91,887
davie-fl.gov 88,123
belmont.gov 87,332
aftac.gov 84,507
careervoyages.gov 57,192
women-21.gov 56,255
egrpra.gov 54,775
4women.gov 45,684
4woman.gov 42,192
nypa.gov 36,099
nhmfl.gov 27,569
darpa.gov 21,454
usafreedomcorps.gov 18,001
peacecore.gov 17,744
californiadesert.gov 15,172
arpa.gov 15,093
okgeosurvey1.gov 14,595
omhrc.gov 14,594
usafreedomcorp.gov 14,298
uscva.gov 13,627
odci.gov 12,920

The thirty domains with the most URLs from EOT2012 that weren’t present in EOT2012.

Domain Count
militaryonesource.mil 859,843
consumerfinance.gov 237,361
nrd.gov 194,215
wh.gov 179,233
pnnl.gov 132,994
eia.gov 112,034
transparency.gov 109,039
nationalguard.mil 108,854
acus.gov 93,810
404.gov 82,409
savingsbondwizard.gov 76,867
treasuryhunt.gov 76,394
fedshirevets.gov 75,529
onrr.gov 75,484
veterans.gov 75,350
broadbandmap.gov 72,889
saferproducts.gov 65,387
challenge.gov 63,808
healthdata.gov 63,105
marinecadastre.gov 62,882
fatherhood.gov 62,132
edpubs.gov 58,356
transportationresearch.gov 58,235
cbca.gov 56,043
usbonds.gov 55,102
usbond.gov 54,847
phe.gov 53,626
ussavingsbond.gov 53,563
scienceeducation.gov 53,468
mda.gov 53,010

Shared domains that changed

There were a number of domains (1,236) that are present in both the EOT2008 and EOT2012 archives.  I thought it would be interesting to compare those domains and see which ones changed the most.  Below are the fifty shared domains that changed the most between EOT2008 and EOT2012.

Domain EOT2008 EOT2012 Change Absolute Change % Change
house.gov 13,694,187 35,894,356 22,200,169 22,200,169 162%
senate.gov 5,043,974 9,924,917 4,880,943 4,880,943 97%
gpo.gov 8,705,511 3,888,645 -4,816,866 4,816,866 -55%
nih.gov 5,276,262 1,267,764 -4,008,498 4,008,498 -76%
nasa.gov 6,693,542 3,063,382 -3,630,160 3,630,160 -54%
navy.mil 94,081 3,611,722 3,517,641 3,517,641 3,739%
usgs.gov 4,896,493 1,690,295 -3,206,198 3,206,198 -65%
loc.gov 5,059,848 7,587,179 2,527,331 2,527,331 50%
hhs.gov 2,361,866 366,024 -1,995,842 1,995,842 -85%
osd.mil 180,046 2,111,791 1,931,745 1,931,745 1,073%
af.mil 230,920 2,067,812 1,836,892 1,836,892 795%
ed.gov 2,334,548 510,413 -1,824,135 1,824,135 -78%
lanl.gov 2,081,275 309,007 -1,772,268 1,772,268 -85%
usda.gov 2,892,923 1,324,049 -1,568,874 1,568,874 -54%
congress.gov 1,554,199 40,338 -1,513,861 1,513,861 -97%
noaa.gov 5,317,872 3,985,633 -1,332,239 1,332,239 -25%
epa.gov 1,628,517 327,810 -1,300,707 1,300,707 -80%
uscourts.gov 1,484,240 184,507 -1,299,733 1,299,733 -88%
dol.gov 1,387,724 88,557 -1,299,167 1,299,167 -94%
census.gov 1,604,505 328,014 -1,276,491 1,276,491 -80%
dot.gov 1,703,935 554,325 -1,149,610 1,149,610 -67%
usbg.gov 1,026,360 6,724 -1,019,636 1,019,636 -99%
doe.gov 1,164,955 268,694 -896,261 896,261 -77%
vaccines.mil 5,665 856,188 850,523 850,523 15,014%
fdlp.gov 991,747 156,499 -835,248 835,248 -84%
uspto.gov 980,215 155,428 -824,787 824,787 -84%
bts.gov 921,756 130,730 -791,026 791,026 -86%
cdc.gov 1,014,213 264,500 -749,713 749,713 -74%
lbl.gov 743,472 4,080 -739,392 739,392 -99%
faa.gov 945,446 206,500 -738,946 738,946 -78%
treas.gov 838,243 99,411 -738,832 738,832 -88%
fema.gov 903,393 172,055 -731,338 731,338 -81%
clinicaltrials.gov 919,490 196,642 -722,848 722,848 -79%
army.mil 2,228,691 2,936,308 707,617 707,617 32%
nsf.gov 760,976 65,880 -695,096 695,096 -91%
prc.gov 740,176 75,682 -664,494 664,494 -90%
doc.gov 823,825 173,538 -650,287 650,287 -79%
fueleconomy.gov 675,522 79,943 -595,579 595,579 -88%
nbii.gov 577,708 391 -577,317 577,317 -100%
defense.gov 687 575,776 575,089 575,089 83,710%
usajobs.gov 3,487 551,217 547,730 547,730 15,708%
sandia.gov 736,032 210,429 -525,603 525,603 -71%
nps.gov 706,323 191,102 -515,221 515,221 -73%
defenselink.mil 502,023 1,868 -500,155 500,155 -100%
fws.gov 625,180 132,402 -492,778 492,778 -79%
ssa.gov 609,784 125,781 -484,003 484,003 -79%
archives.gov 654,689 175,585 -479,104 479,104 -73%
fnal.gov 575,167 1,051,926 476,759 476,759 83%
change.gov 486,798 24,820 -461,978 461,978 -95%
buyusa.gov 490,179 37,053 -453,126 453,126 -92%

Only 11 of the 50 (22%) resulted in more content harvested in EOT2012 than EOT2012.

Of the eleven domains that had more content harvested for them in EOT2012 there were five navy.mil, osd.mil, vaccines.mil, defense.gov, and usajobs.gov that increased by over 1,000% in the amount of content.  I don’t know if this is necessarily a result in an increase in attention to these sites, more content on the sites, or a different organization of the sites that made them easier to harvest.  I suspect it is some combination of all three of those things.

Summary

It should be expected that there are going to be domains that come into and go out of existence on a regular basis in a large web space like the federal government.  One of the things that I think is rather challenging to identify is a list of domains that were present at one given time within an organization.  For example “what domains did the federal government have in 1998?”.  It seems like a way to come up with that answer is to use web archives. We see based on the analysis in this post that there are 411 domains that were present in 2008 that we weren’t able to capture in 2012.  Take a look at that list of the top thirty,  did you recognize any of those? How many other initiatives, committees, agencies, task forces, and citizen education portals existed at one point that are now gone?

If you have questions or comments about this post,  please let me know via Twitter.

Comparing Web Archives: EOT2008 and EOT2012 – Where

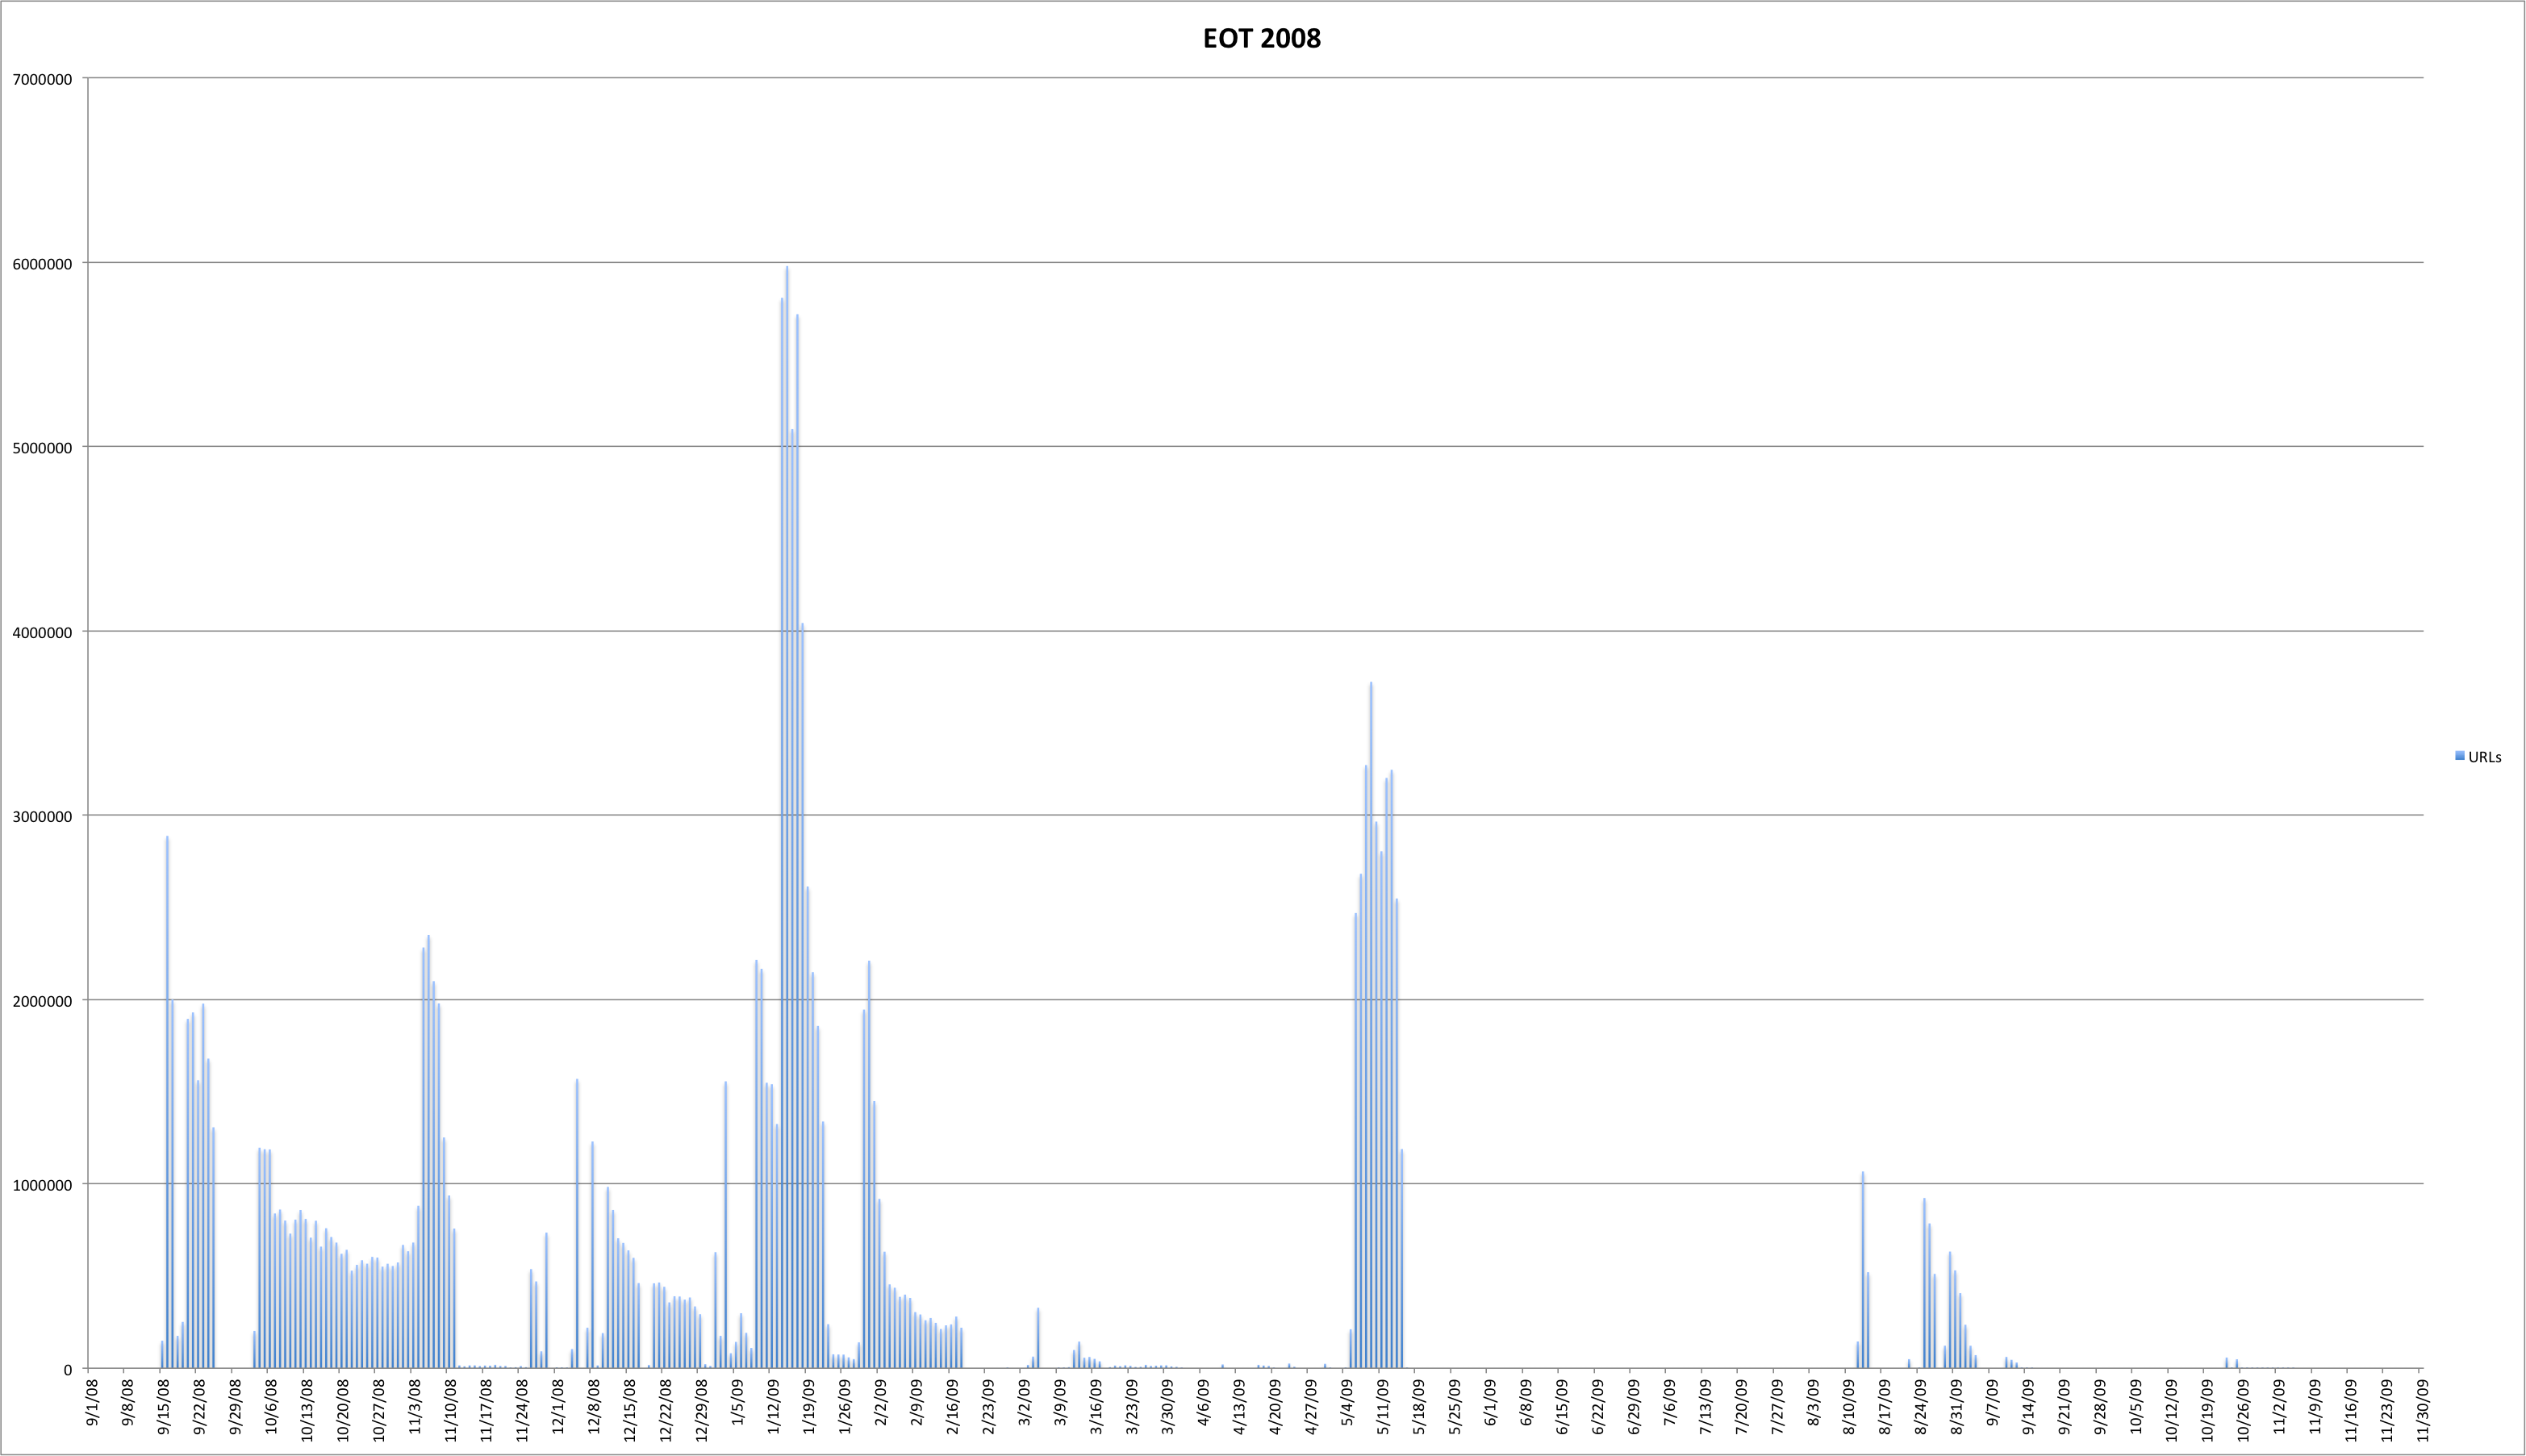
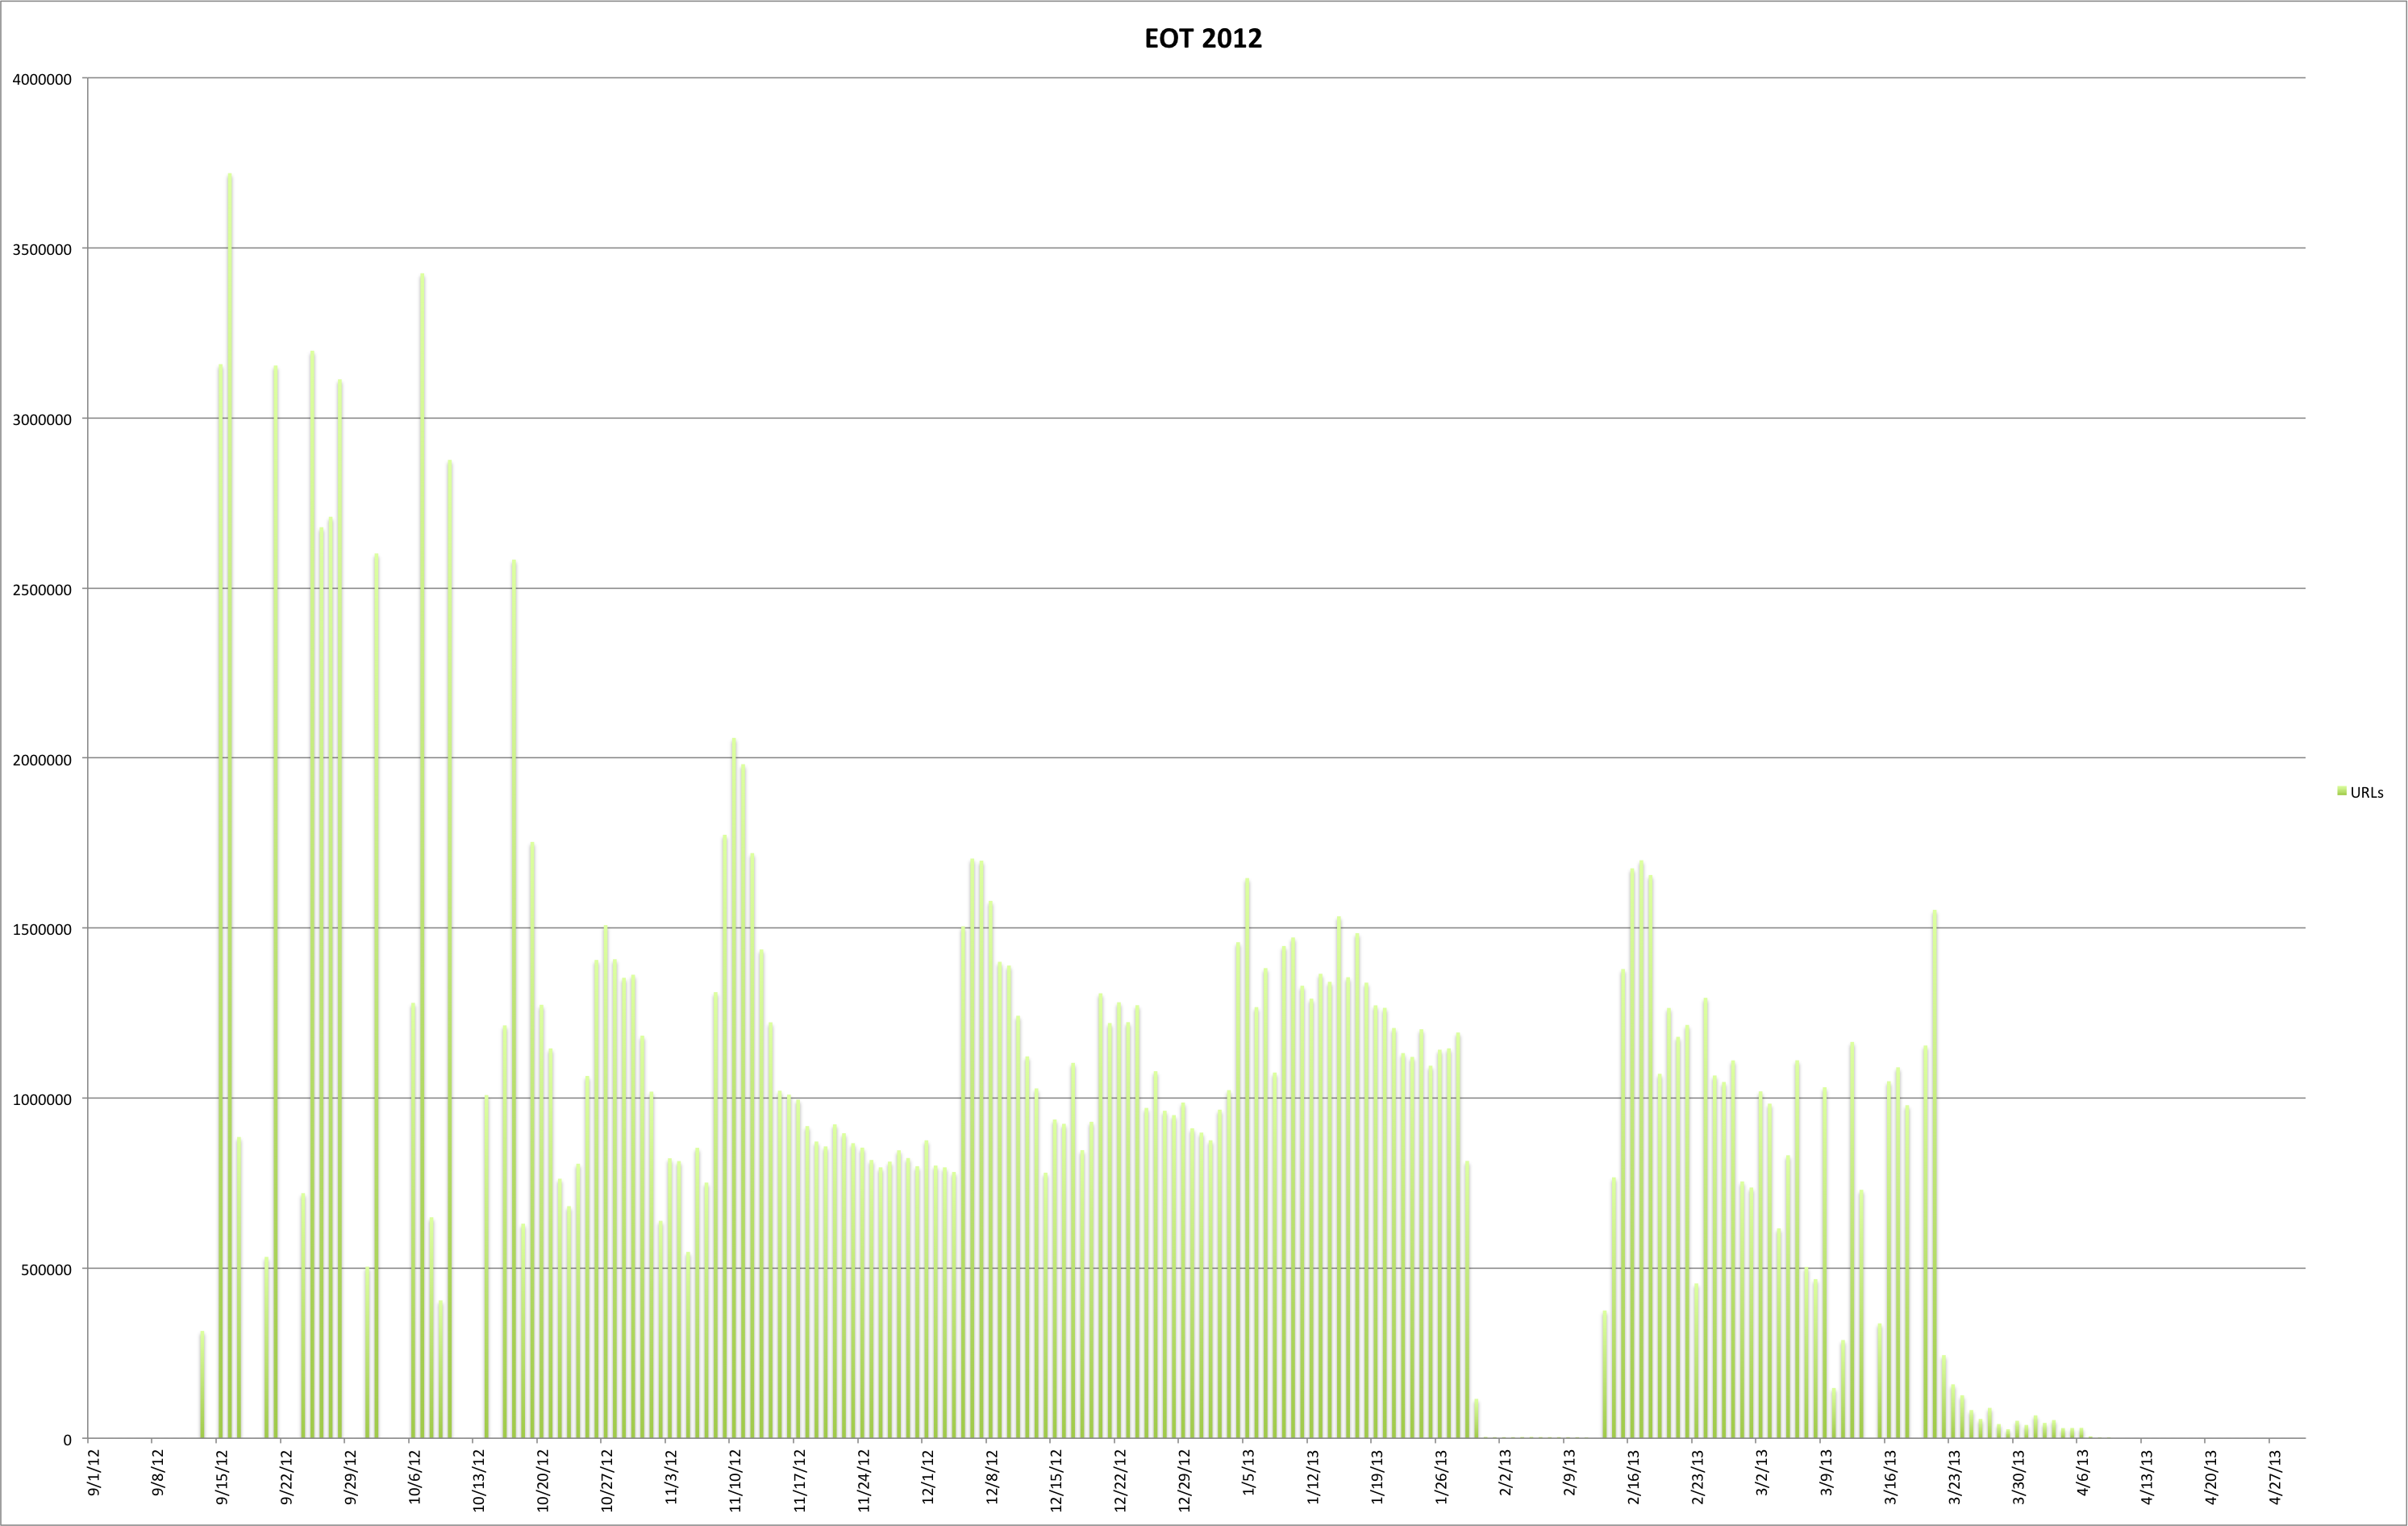
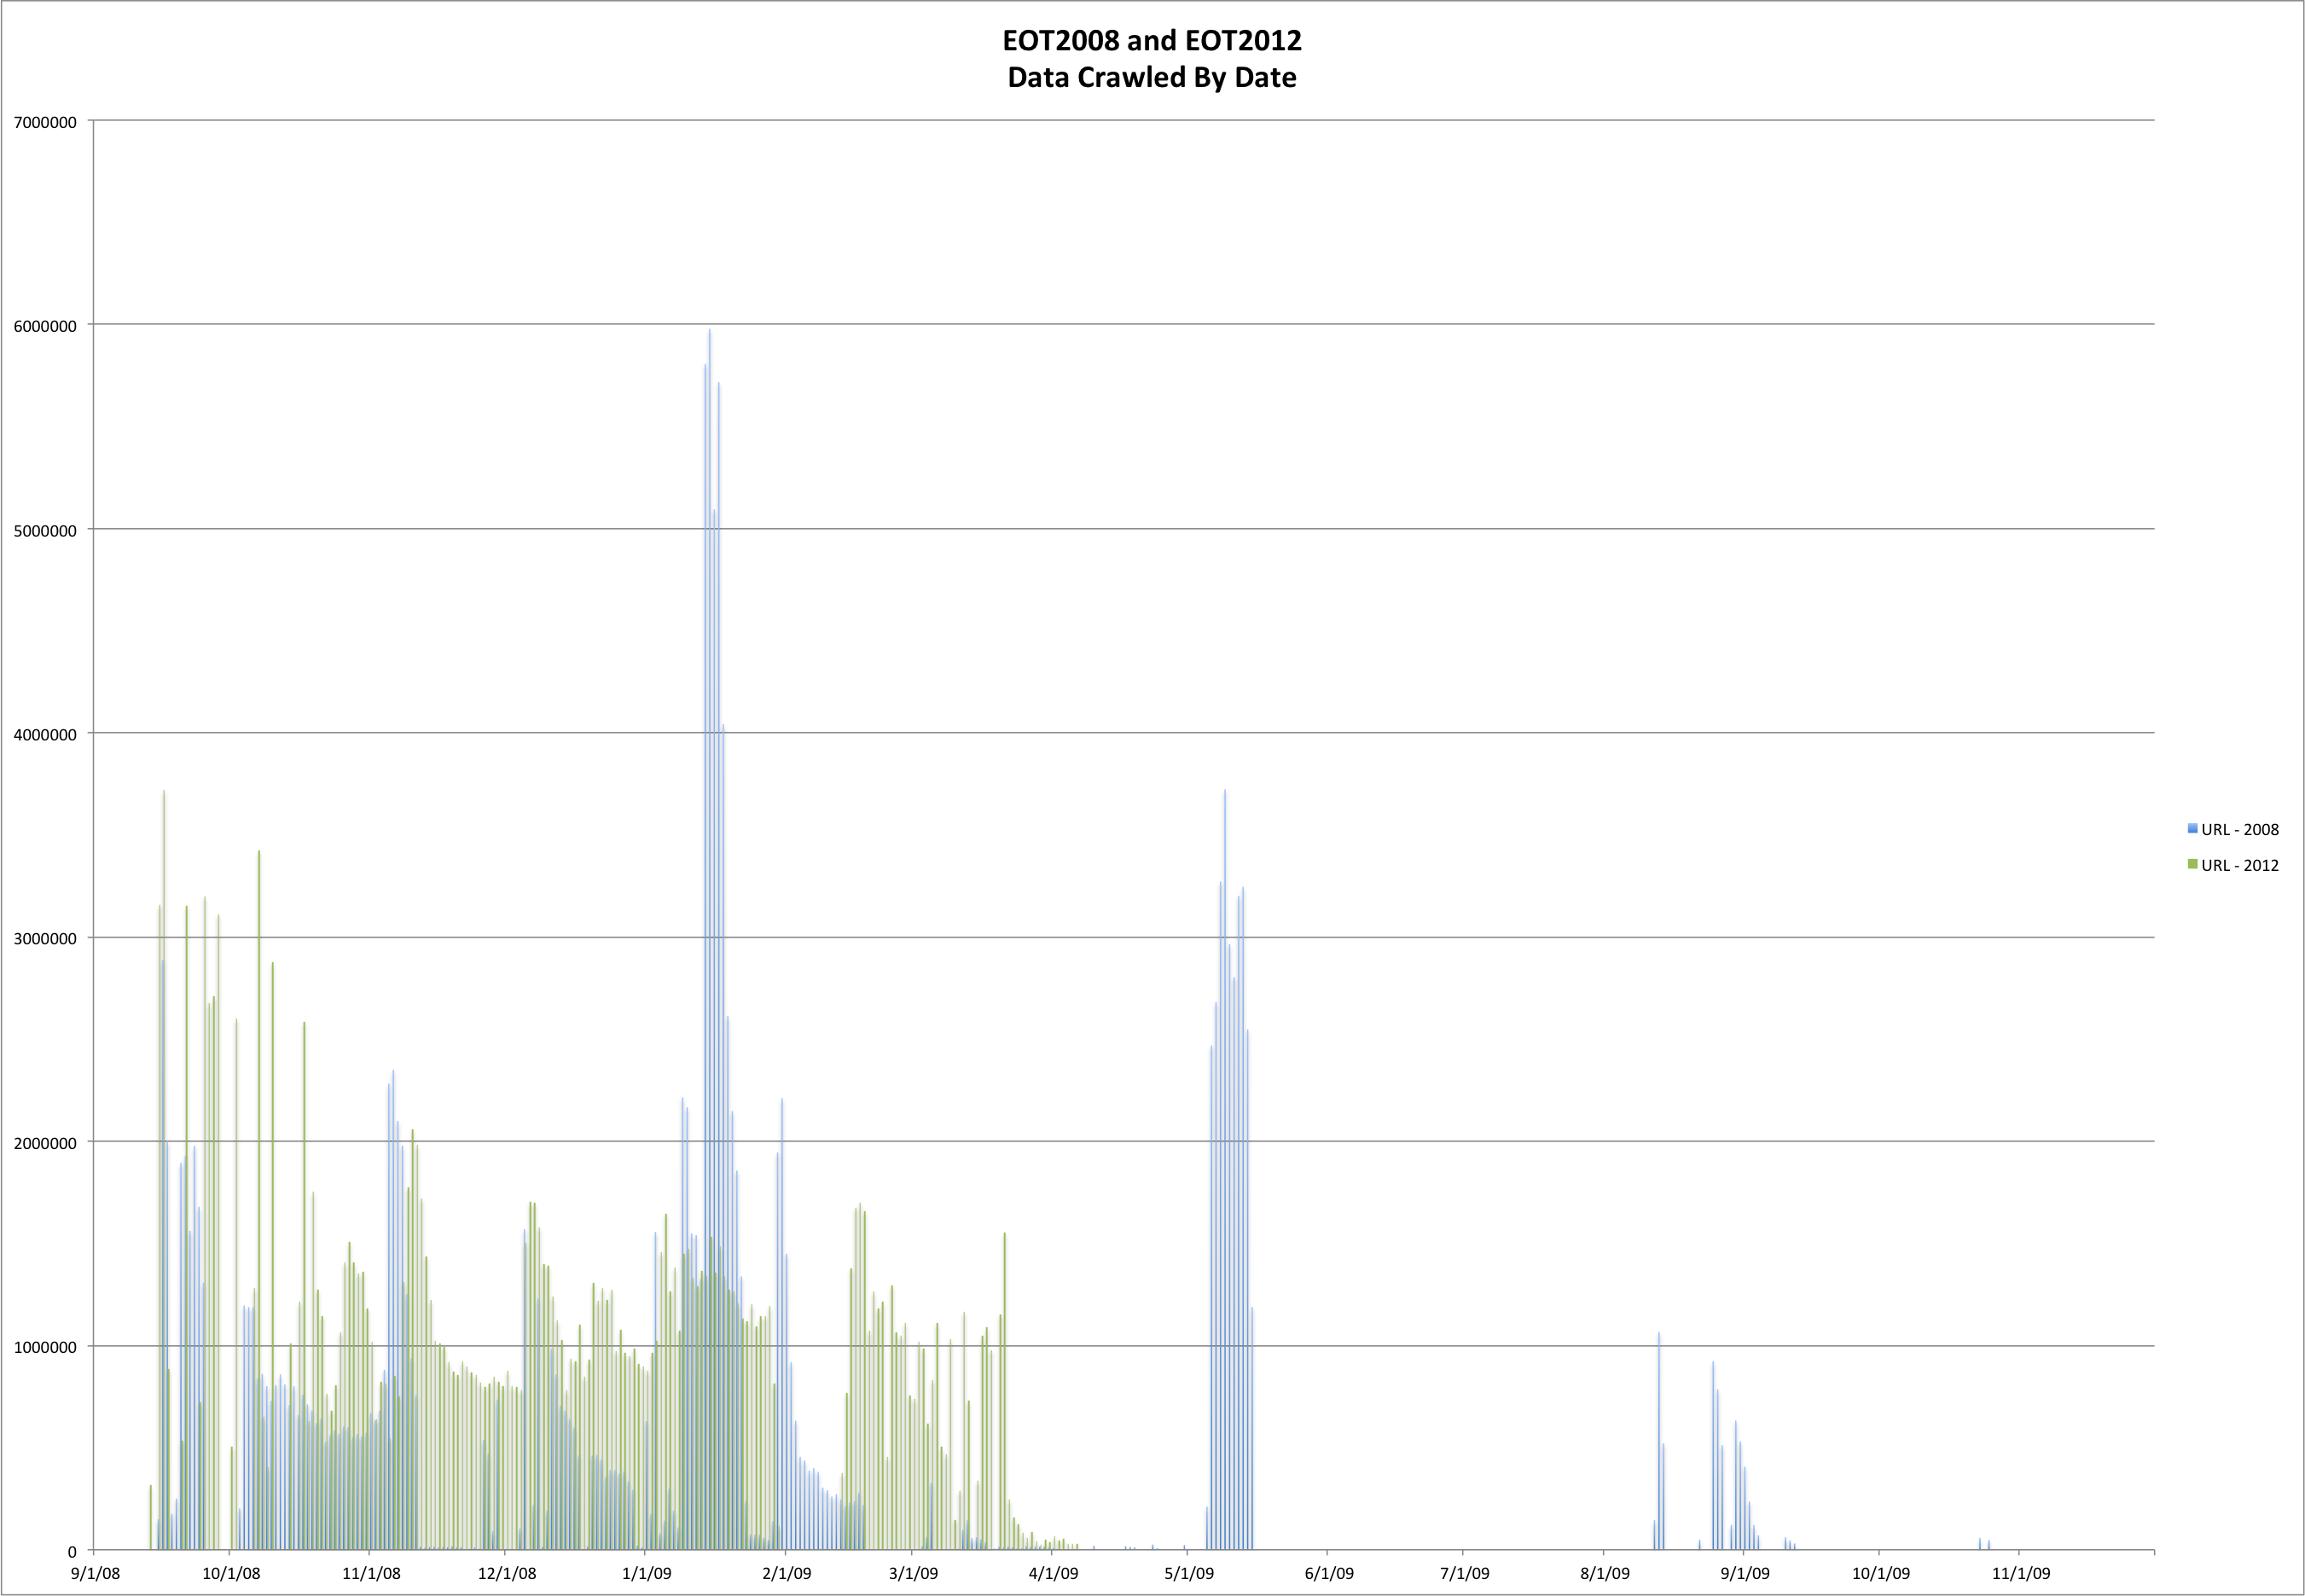
This post carries on in the analysis of the End of Term web archives for 2008 and 2012. Previous posts in this series discuss when content was harvested and what kind of content was harvested and included in the archives.

In this post we will look at where content came from, specifically the data held in the top level domains, domain names and sub-domain names.

Top Level Domains

The first thing to look at is the top level domains for all of the URLs in the CDX files.

In the EOT2008 archive there are a total of 241 unique TLDs.  In the EOT2012 archive there are a total of 251 unique TLDs.  This is a modest increase of 4.15% from EOT2008 to EOT2012.

The EOT2008 and EOT2012 archives share 225 TLDs between the two archives.  There are 16 TLDs that are unique to the EOT2008 archive and 26 TLDs that are unique to the EOT2012 archive.

TLDs unique to EOT2008

Unique to 2008 URLs from TLD
null 18,772
www 583
yu 357
labs 20
webteam 16
cg 10
security 8
ssl 8
b 8
css 7
web 6
dev 4
education 4
misc 2
secure 2
campaigns 2

TLDs unique to EOT2012

Unique to 2012 URLs from TLD
whois 17,500
io 7,935
pn 987
sy 541
lr 478
so 418
nr 363
tf 291
xxx 258
re 186
xn--p1ai 171
bi 153
dm 120
tel 78
ck 65
ax 64
sx 54
tg 50
ki 48
gg 25
kn 25
gp 24
pm 20
fk 18
cf 7
wf 3

I believe that the “null” TLD from EOT2008 is an artifact of the crawling process and possibly represents rows in the CDX file that correspond to metadata records in the warc/arcs from 2008.  I will have to do some digging to confirm.

Change in TLD

Next up we take a look at the 225 TLDs that are shared between the archives. First up are the fifteen most changed based on the increase or decrease in the number of URLs from that TLD

TLD eot2008 eot2012 Change Absolute Change % change
com 7,809,711 45,594,482 37,784,771 37,784,771 483.8%
gov 137,829,050 109,141,353 -28,687,697 28,687,697 -20.8%
mil 3,555,425 16,223,861 12,668,436 12,668,436 356.3%
net 653,187 9,269,406 8,616,219 8,616,219 1319.1%
edu 3,552,509 2,442,626 -1,109,883 1,109,883 -31.2%
int 135,939 685,168 549,229 549,229 404.0%
uk 70,262 594,020 523,758 523,758 745.4%
ly 95 503,457 503,362 503,362 529854.7%
org 5,108,645 5,588,750 480,105 480,105 9.4%
us 840,516 474,156 -366,360 366,360 -43.6%
co 2,839 211,131 208,292 208,292 7336.8%
be 4,019 203,178 199,159 199,159 4955.4%
jp 23,896 220,602 196,706 196,706 823.2%
me 35 182,963 182,928 182,928 522651.4%
tv 10,373 191,736 181,363 181,363 1748.4%

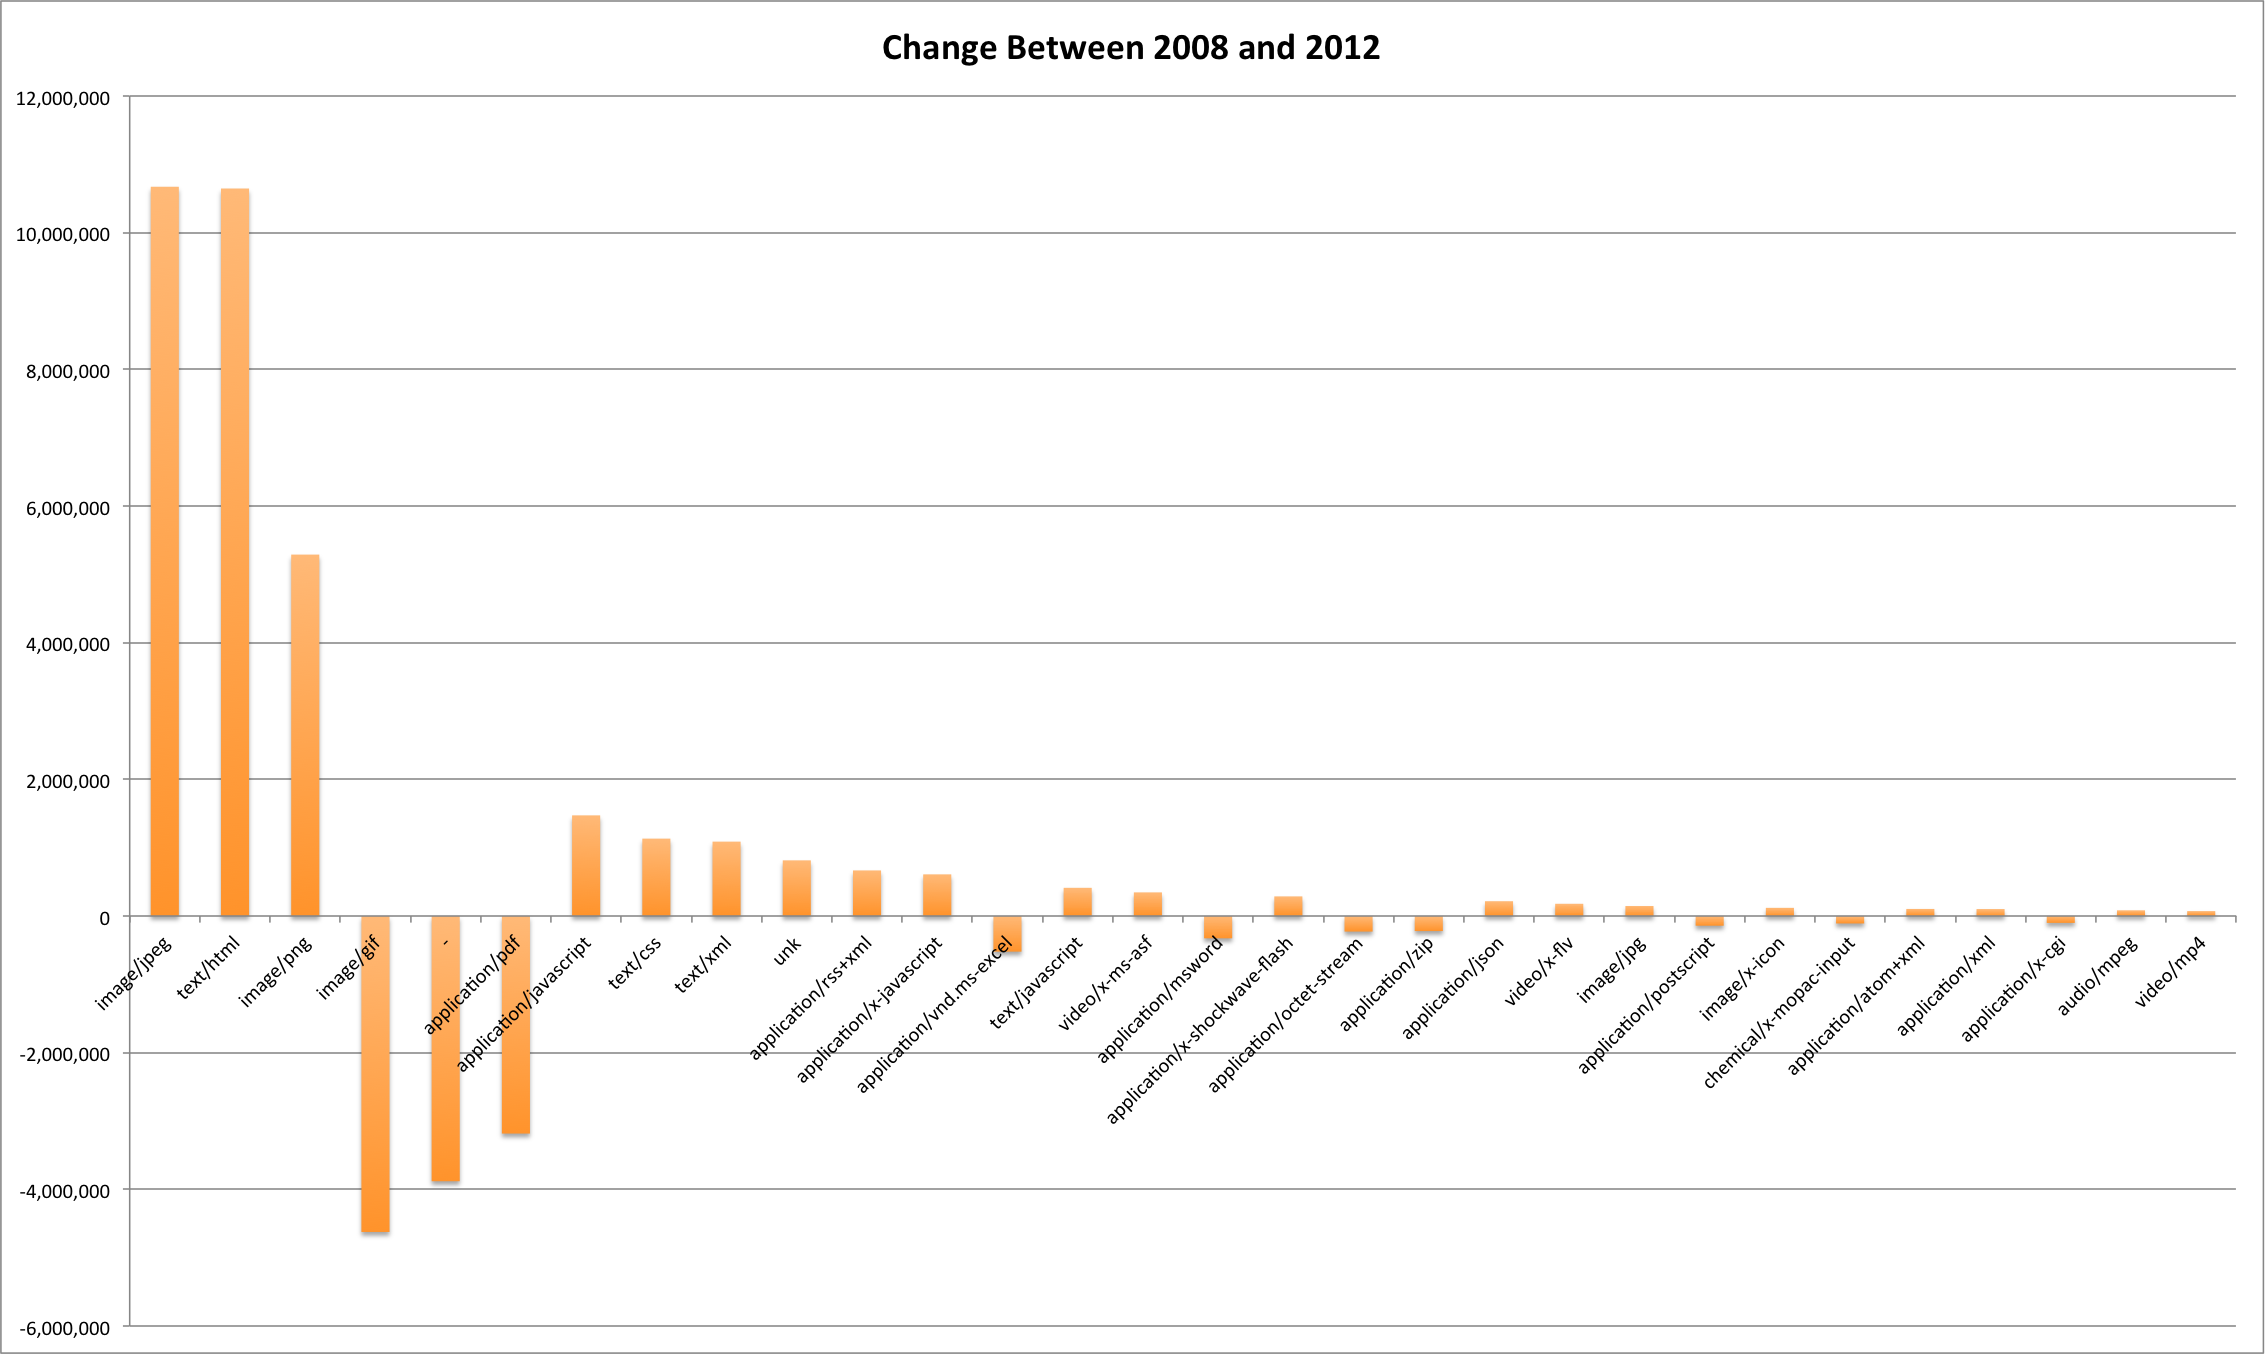
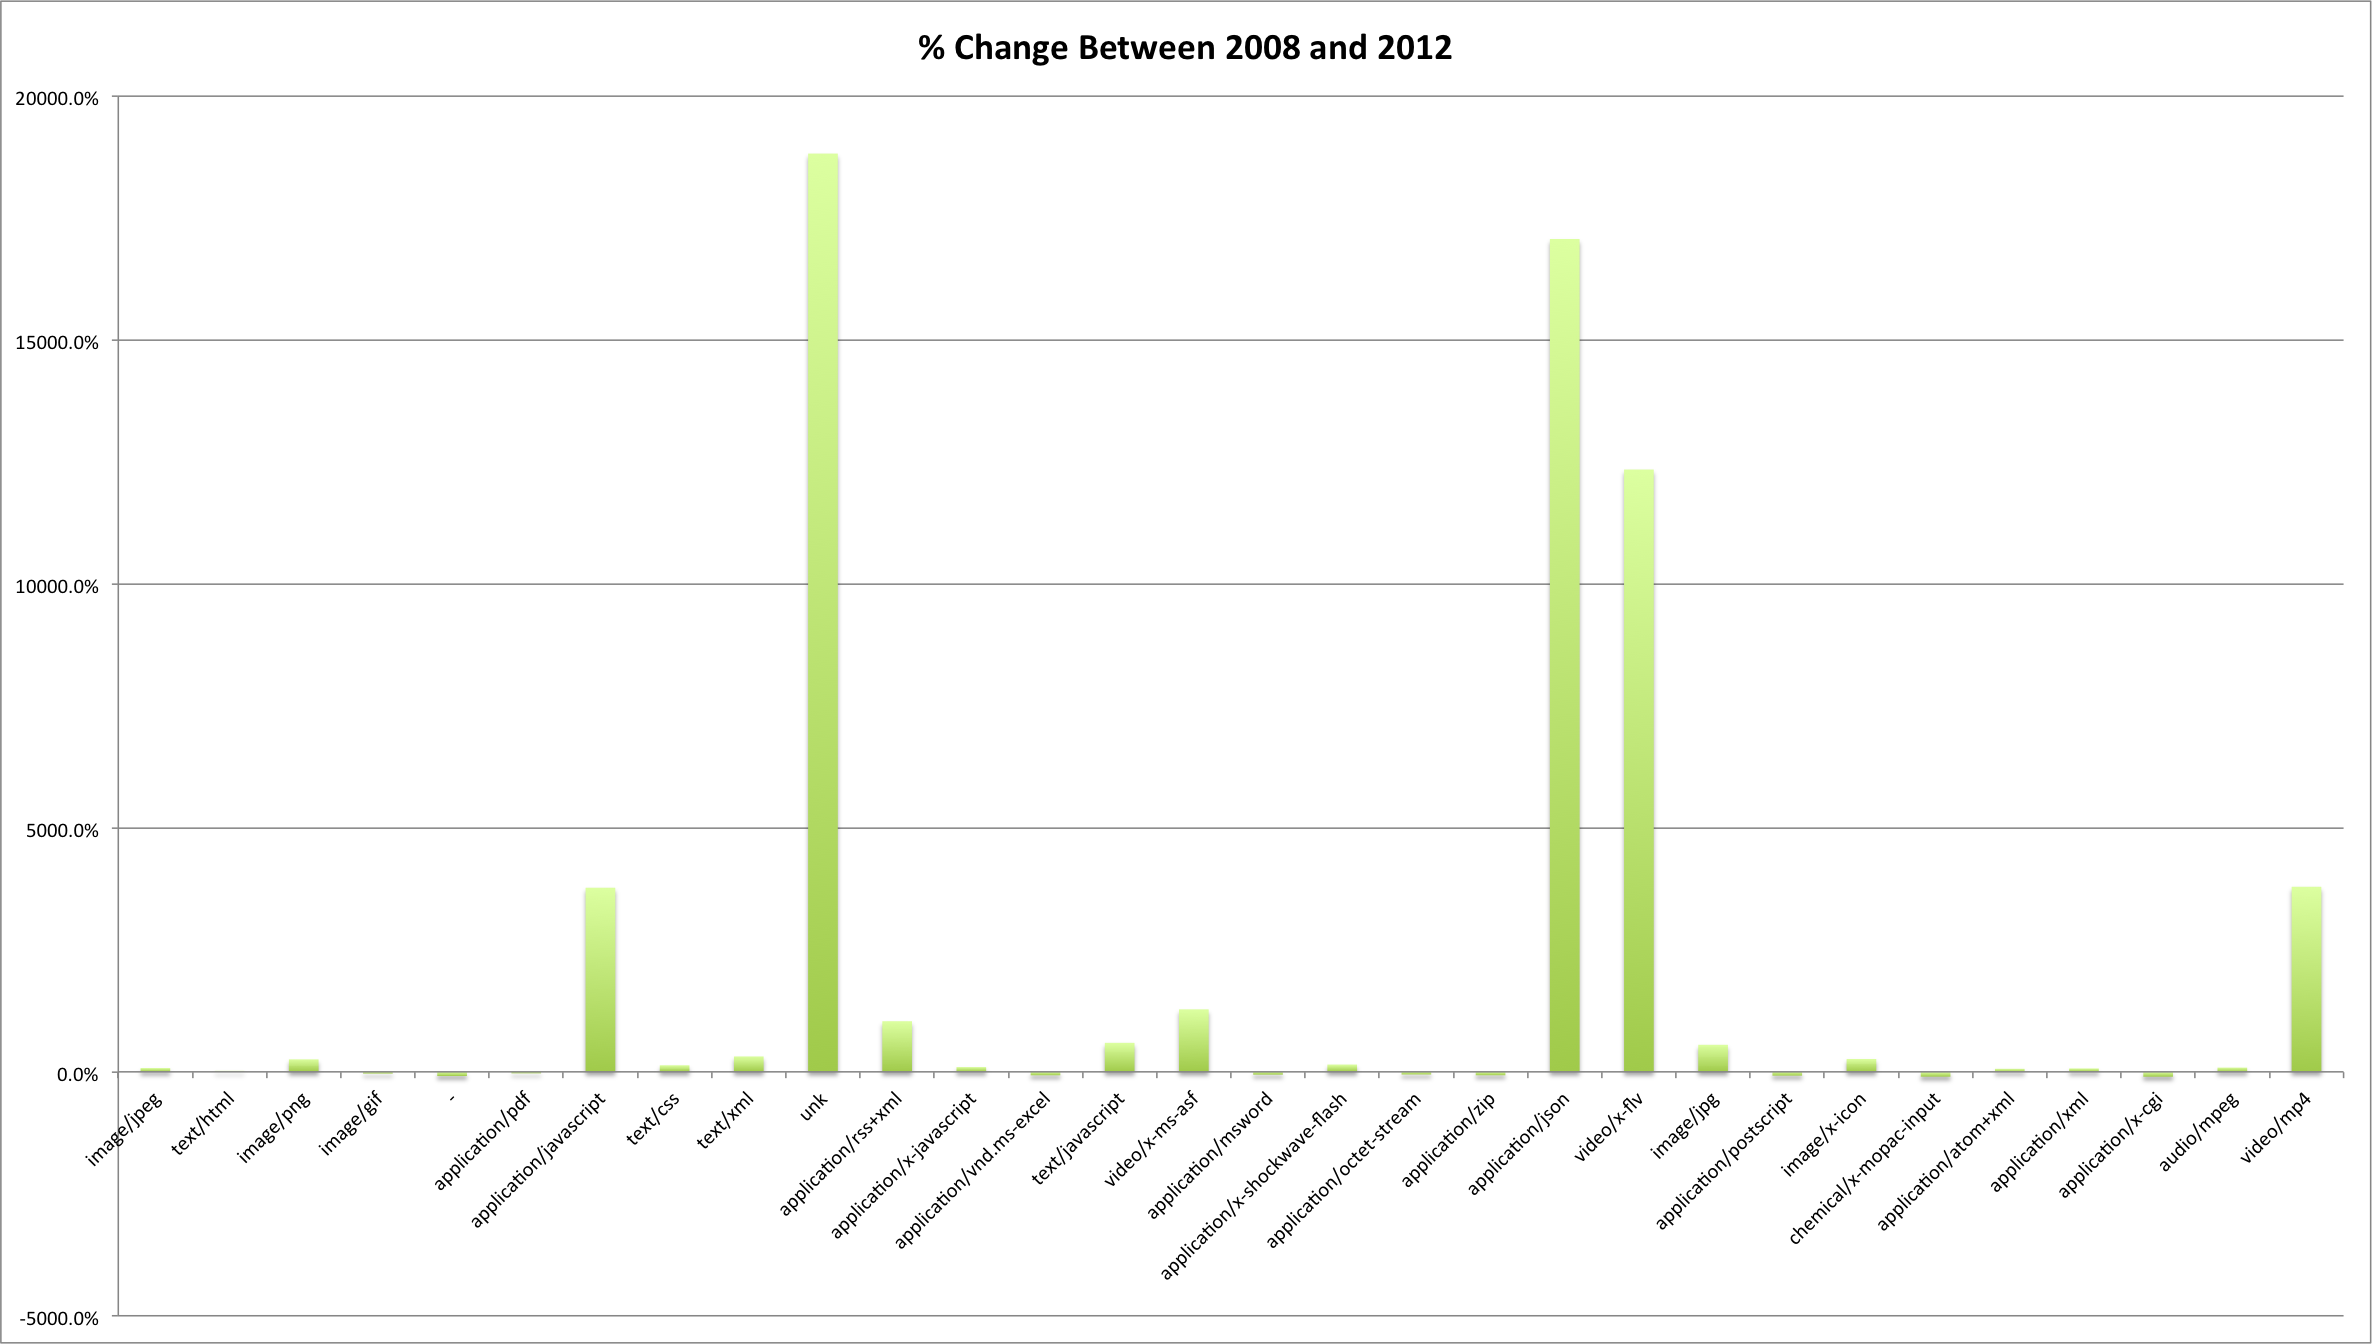
Interesting is the change in the first two.  There was an increase of over 37 million URLs (484%) for the com TDL between EOT2008 and EOT2012.  There was also a decrease (-21%) or over 28 million URLs for the gov TLD.  The mil TLD also increased by 356% between the EOT2008 and EOT2012 harvests with an increase of over 12 million URLs.

You can see that .ly and .me increased by some serious percentage,  529,855% and 522,651% respectively.

Taking a look at just the percent of change, here are the five most changed based on that percentage

TLD eot2008 eot2012 Change Absolute Change % change
ly 95 503,457 503,362 503,362 529854.7%
me 35 182,963 182,928 182,928 522651.4%
gl 129 49,733 49,604 49,604 38452.7%
gd 9 3,273 3,264 3,264 36266.7%
cat 43 11,703 11,660 11,660 27116.3%

I have a feeling that at the majority of the ly, me, gl, and gd TLD content came in as redirect URLs from link shortening services.

Domain Names

There are 87,889 unique domain names in the EOT2008 archive, this increases dramatically in the EOT2012 archive to 186,214 which is an increase of 118% in the number of domain names.

There are 30,066 domain names that are shared between the two archives.  There are 57,823 domain names that are unique to the EOT2008 archive and 156.148 domain names that are unique to the EOT2012 archive.

Here is a table showing thirty of the domains that were only present in the EOT2008 archive ordered by the number of URLs from that domain.

TLD Count
geodata.gov 812,524
nifl.gov 504,910
stat-usa.gov 398,961
tradestatsexpress.gov 243,729
arnet.gov 174,057
acqnet.gov 171,493
dccourts.gov 161,289
meish.org 147,261
web-services.gov 137,202
metrokc.gov 132,210
sdi.gov 91,887
davie-fl.gov 88,123
belmont.gov 87,332
aftac.gov 84,507
careervoyages.gov 57,192
women-21.gov 56,255
egrpra.gov 54,775
4women.gov 45,684
4woman.gov 42,192
nypa.gov 36,099
secure-banking.com 33,059
nhmfl.gov 27,569
darpa.gov 21,454
usafreedomcorps.gov 18,001
peacecore.gov 17,744
californiadesert.gov 15,172
federaljudgesassoc.org 15,126
arpa.gov 15,093
transportationfortomorrow.org 14,926
okgeosurvey1.gov 14,595

Here is the same kind of table but this time for the EOT2012 dataset.

TLD Count
militaryonesource.mil 859,843
yfrog.com 682,664
staticflickr.com 640,606
akamaihd.net 384,769
4sqi.net 350,707
foursquare.com 340,492
adf.ly 334,767
pinterest.com 244,293
consumerfinance.gov 237,361
nrd.gov 194,215
wh.gov 179,233
t.co 175,033
youtu.be 172,301
sndcdn.com 161,039
pnnl.gov 132,994
eia.gov 112,034
transparency.gov 109,039
nationalguard.mil 108,854
acus.gov 93,810
nrsc.org 85,925
mzstatic.com 84,202
404.gov 82,409
savingsbondwizard.gov 76,867
treasuryhunt.gov 76,394
mynextmove.org 75,927
fedshirevets.gov 75,529
onrr.gov 75,484
veterans.gov 75,350
broadbandmap.gov 72,889
ntm-a.com 71,126

Those are pretty long tables but I think they start to point at some interesting things from this analysis.  The domains that were present and harvested in 2008 and that weren’t harvested in 2012.  In looking at the list, some of them (metrokc.gov, davie-fl.gov, okgeosurvey1.gov) were most likely out of scope for “Federal Web” but got captured because of the gov TLD.

In the EOT2012 list you start to see artifacts from an increase in attention to social media site capture for the EOT2012 project.  Sites like yfrog.com, staticflickr.com, adf.ly, t.co, youtu.be, foursquare.com, pintrest.com probably came from that increased attention.

Here is a list of the twenty most changed domains from EOT2008 to EOT2012.  This number is based on the absolute change in the number of URLs captured for each of the archives.

Domain EOT2008 EOT2012 Change Abolute Change % Change
house.gov 13,694,187 35,894,356 22,200,169 22,200,169 162%
facebook.com 11,895 7,503,640 7,491,745 7,491,745 62,982%
dvidshub.net 1,097 5,612,410 5,611,313 5,611,313 511,514%
senate.gov 5,043,974 9,924,917 4,880,943 4,880,943 97%
gpo.gov 8,705,511 3,888,645 -4,816,866 4,816,866 -55%
nih.gov 5,276,262 1,267,764 -4,008,498 4,008,498 -76%
nasa.gov 6,693,542 3,063,382 -3,630,160 3,630,160 -54%
navy.mil 94,081 3,611,722 3,517,641 3,517,641 3,739%
usgs.gov 4,896,493 1,690,295 -3,206,198 3,206,198 -65%
loc.gov 5,059,848 7,587,179 2,527,331 2,527,331 50%
flickr.com 157,155 2,286,890 2,129,735 2,129,735 1,355%
youtube.com 346,272 2,369,108 2,022,836 2,022,836 584%
hhs.gov 2,361,866 366,024 -1,995,842 1,995,842 -85%
osd.mil 180,046 2,111,791 1,931,745 1,931,745 1,073%
af.mil 230,920 2,067,812 1,836,892 1,836,892 795%
ed.gov 2,334,548 510,413 -1,824,135 1,824,135 -78%
granicus.com 782 1,785,724 1,784,942 1,784,942 228,253%
lanl.gov 2,081,275 309,007 -1,772,268 1,772,268 -85%
usda.gov 2,892,923 1,324,049 -1,568,874 1,568,874 -54%
googleusercontent.com 2 1,560,457 1,560,455 1,560,455 78,022,750%

You see big increases in facebook.com (+62,982%), flickr.com (+1,355%), youtube.com (584%) and googleusercontent.com (78,022,750%) in content from EOT2008 to EOT2012.

Other increases that are notable include dvidshub.net which is the domain for a site called Defense Video & Imagery Distribution System that increased by 511,514%, navy.mil (3,739%), osd.mil (1,073%), af.mil (795%).  I like to think this speaks to a desired increase in attention to .mil content in the EOT2012 project.

Another domain that stands out to me is granicus.com which I was unaware of but after a little looking turns out to be one of the big cloud service providers for the federal government (or at least it was according to the EOT2012 dataset).

.gov and .mil subdomains

The last piece I wanted to look at related to domain names was to see what sort of changes there were in the gov and mil portions of the EOT2008 and EOT2012 crawls.  This time I wanted to look at the subdomains.

I filtered my dataset a bit so that I was only looking at the .mil and .gov content.

In the EOT2008 archive there were a total of 16,072 unique subdomains and in EOT2012 there were 22,477 subdomains.  This is an increase of 40% between the two archive projects.

The EOT2008 has 5,371 subdomains unique to its holdings and EOT2012 has 11,776 unique subdomains.

Subdomains that had the most content (based on URLs downloaded) and which are only present in EOT2008 are presented below.  (Limited to the top 30)

EOT2008 Subdomain Count
gos2.geodata.gov 809,442
boucher.house.gov 772,759
kendrickmeek.house.gov 685,368
citizensbriefingbook.change.gov 446,632
stat-usa.gov 305,936
nifl.gov 285,833
scidac-new.ca.sandia.gov 247,451
tradestatsexpress.gov 243,729
hpcf.nersc.gov 221,626
gopher.info.usaid.gov 219,051
novel.nifl.gov 218,962
dli2.nsf.gov 206,932
contractorsupport.acf.hhs.gov 188,841
pnwin.nbii.gov 188,591
faq.acf.hhs.gov 184,212
ccdf.acf.hhs.gov 182,606
arnet.gov 174,018
regulations.acf.hhs.gov 171,762
acqnet.gov 171,493
dccourts.gov 161,289
employers.acf.hhs.gov 139,141
search.info.usaid.gov 137,816
web-services.gov 137,202
earth2.epa.gov 136,441
cjtf7.army.mil 134,507
ncweb-north.wr.usgs.gov 134,486
opre.acf.hhs.gov 133,689
childsupportenforcement.acf.hhs.gov 132,023
modis-250m.nascom.nasa.gov 128,810
casd.uscourts.gov 124,146

Here is the same sort of data for the EOT2012 dataset

EOT2012 Subdomain Count
militaryonesource.mil 698,035
uscodebeta.house.gov 387,080
democrats.foreignaffairs.house.gov 312,270
gulflink.fhpr.osd.mil 262,246
coons.senate.gov 257,721
democrats.energycommerce.house.gov 243,341
consumerfinance.gov 225,815
dcmo.defense.gov 217,255
nrd.gov 187,267
wh.gov 179,103
usaxs.xray.aps.anl.gov 178,298
democrats.budget.house.gov 175,109
democrats.edworkforce.house.gov 162,077
apps.militaryonesource.mil 157,144
naturalresources.house.gov 155,918
purl.fdlp.gov 154,718
media.dma.mil 137,581
algreen.house.gov 131,388
democrats.transportation.house.gov 129,345
democrats.naturalresources.house.gov 124,808
hanabusa.house.gov 123,794
pitts.house.gov 122,402
visclosky.house.gov 122,223
garamendi.house.gov 114,221
vault.fbi.gov 113,873
green.house.gov 113,040
sewell.house.gov 112,973
levin.house.gov 111,971
eia.gov 111,889
hahn.house.gov 111,024

This last table is a little long,  but I found the data pretty interesting to look at.   The table below shows the biggest change for domains and subdomains that were shared between the EOT2008 and EOT2012 archives. I’ve included the top forty entries for that list.

Subdomain/Domain EOT2008 EOT2012 Change Absolute Change % Change
listserv.access.gpo.gov 2,217,565 7,487 -2,210,078 2,210,078 -100%
carter.house.gov 1,898,462 29,680 -1,868,782 1,868,782 -98%
catalog.gpo.gov 1,868,504 34,040 -1,834,464 1,834,464 -98%
loc.gov 63,534 1,875,264 1,811,730 1,811,730 2,852%
gpo.gov 52,427 1,796,925 1,744,498 1,744,498 3,327%
bensguide.gpo.gov 90,280 1,790,017 1,699,737 1,699,737 1,883%
edocket.access.gpo.gov 1,644,578 7,822 -1,636,756 1,636,756 -100%
nws.noaa.gov 103,367 1,676,264 1,572,897 1,572,897 1,522%
navair.navy.mil 220 1,556,320 1,556,100 1,556,100 707,318%
congress.gov 1,525,467 356 -1,525,111 1,525,111 -100%
cha.house.gov 1,366,520 109,192 -1,257,328 1,257,328 -92%
usbg.gov 1,026,360 6,724 -1,019,636 1,019,636 -99%
dol.gov 1,052,335 41,909 -1,010,426 1,010,426 -96%
resourcescommittee.house.gov 1,008,655 335 -1,008,320 1,008,320 -100%
calvert.house.gov 20,530 1,014,416 993,886 993,886 4,841%
fdlp.gov 989,415 1,554 -987,861 987,861 -100%
lcweb2.loc.gov 466,623 1,451,708 985,085 985,085 211%
cramer.house.gov 1,011,872 60,879 -950,993 950,993 -94%
ed.gov 1,141,069 241,165 -899,904 899,904 -79%
vaccines.mil 5,638 856,113 850,475 850,475 15,085%
clinicaltrials.gov 919,362 193,158 -726,204 726,204 -79%
army.mil 4,831 725,934 721,103 721,103 14,927%
boehner.house.gov 7,472 695,625 688,153 688,153 9,210%
nces.ed.gov 702,644 31,922 -670,722 670,722 -95%
prc.gov 739,849 75,682 -664,167 664,167 -90%
navy.mil 1,481 654,254 652,773 652,773 44,077%
house.gov 818,095 172,066 -646,029 646,029 -79%
fueleconomy.gov 675,522 79,943 -595,579 595,579 -88%
fema.gov 636,005 53,321 -582,684 582,684 -92%
frwebgate.access.gpo.gov 621,361 55,097 -566,264 566,264 -91%
siadapp.dmdc.osd.mil 43 559,076 559,033 559,033 1,300,077%
fdsys.gpo.gov 548,618 28 -548,590 548,590 -100%
tiger.census.gov 549,046 750 -548,296 548,296 -100%
rs6.loc.gov 550,489 6,695 -543,794 543,794 -99%
bennelson.senate.gov 16,203 553,698 537,495 537,495 3,317%
crapo.senate.gov 28,569 540,928 512,359 512,359 1,793%
eia.doe.gov 508,675 1,629 -507,046 507,046 -100%
epa.gov 623,457 117,794 -505,663 505,663 -81%
defenselink.mil 502,006 1,866 -500,140 500,140 -100%
access.gpo.gov 472,373 3,110 -469,263 469,263 -99%

I find this table interesting for a number of reasons.  First you see quite a bit more decline that I have seen in my other tables like this.  In fact 26 of the 40 subdomains/domains (54%) on this list decreased from EOT2008 to EOT2012.

In looking at the list as well I can see some of the sites that I can see the transition of some of the sites within GPO, for example access.gpo.gov going down 90% in captured content, fdsys.gpo.gov going down by 94%, bensguide.gpo.gov increasing by 1,883%.

Wrapping Up

I like to think that it helps to justify some of the work that the partners of the End of Term project are committing to the project when you see that there are large numbers of domains and subdomains that existed in 2008 but that weren’t crawled again in 2012 (and we can only assume they weren’t around in 2012).

There are a few more things I want to look at in this work so stay tuned.

If you have questions or comments about this post,  please let me know via Twitter.

Comparing Web Archives: EOT2008 and EOT2012 – What

This post carries on from where the previous post in this series ended.

A very quick recap,  this series is trying to better understand the EOT2008 and the EOT2012 web archives.  The goal is to see how they are similar, how they are different, and if there is anything that can be learned that will help us with the upcoming EOT2016 project.

What

The CDX files we are using has a column that contains the Media Type (MIME Type) for the different URIs in the WARC files.  A list of the assigned Media Types are available at the International Assigned Numbers Authority (IANA) in their Media Type Registry.

This is a field that is inherently “dirty” for a few reasons.  This field is populated from a field in the WARC Record that comes directly from the web server that responded to the initial request.  Usually these are fairly accurate but there are many times where they are either wrong or at the least confusing.  Often times this is caused by  a server administrator, programmer, or system architect that is trying to be clever,  or just misconfigured something.

I looked at the Media Types for the two EOT collections to see if there are any major differences between what we collected in the two EOT archives.

In the EOT2008 archive there are a total of 831 unique Mime/Media Types,  in the EOT2012 there are a total of 1,208 unique type values.

I took the top 20 Mime/Media Types for each of the archives and pushed them together to see if there was any noticeable change in what we captured between the two archives.  In addition to just the raw counts I also looked at what percentage of the archive a given Media Type represented.  Finally I noted the overall change in those two percentages.

Media Type 2008 Count % of Archive 2012 Count % of Archive % Change Change in % of Archive
text/html 105,592,852 65.9% 116,238,952 59.9% 10.1% -6.0%
image/jpeg 13,667,545 8.5% 24,339,398 12.5% 78.1% 4.0%
image/gif 13,033,116 8.1% 8,408,906 4.3% -35.5% -3.8%
application/pdf 10,281,663 6.4% 7,097,717 3.7% -31.0% -2.8%
4,494,674 2.8% 613,187 0.3% -86.4% -2.5%
text/plain 3,907,202 2.4% 3,899,652 2.0% -0.2% -0.4%
image/png 2,067,480 1.3% 7,356,407 3.8% 255.8% 2.5%
text/css 841,105 0.5% 1,973,508 1.0% 134.6% 0.5%

Because I like pictures here is a chart of the percent change.

Change in Media Type

If we compare the Media Types between the two archives we find that the two archives share 527 Media Types.  The EOT2008 archive has 304 Media Types that aren’t present in EOT2012 and EOT2012 has 681 Media Types that aren’t present in EOT2008.

The ten most frequent Media Types by count found only in the EOT2008 archive are presented below.

Media Type Count
no-type 405,188
text/x-vcal 17,368
.wk1 8,761
x-text/tabular 5,312
application/x-wp 5,158
* 4,318
x-application/pdf 3,660
application/x-gunzip 3,374
image/x-fits 3,340
WINDOWS-1252 2,304

The ten most frequent Media Types by count found only in the EOT2012 archive are presented below.

Media Type Count
warc/revisit 12,190,512
application/http 1,050,895
application/x-mpegURL 23,793
img/jpeg 10,466
audio/x-flac 7,251
application/x-font-ttf 7,015
application/x-font-woff 6,852
application/docx 3,473
font/ttf 3,323
application/calendar 2,419

In the EOT2012 archive the team that captured content had fully moved to the WARC format for storing Web archive content.  The warc/revisit records are records for URLs that had not changed content-wise across more than one crawl.  Instead of storing the URL again, there is a reference to the previously captured content in the warc/revisit record.  That’s why there are so many of these Media types.

Below is a table showing the thirty most changed Media Types that are present in both the EOT2008 and EOT2012 archives.  You can see both the change in overall numbers as well as the percentage change between the two archives.

Media Type EOT2008 EOT2012 Change % Change
image/jpeg 13,667,545 24,339,398 10,671,853 78.1%
text/html 105,592,852 116,238,952 10,646,100 10.1%
image/png 2,067,480 7,356,407 5,288,927 255.8%
image/gif 13,033,116 8,408,906 -4,624,210 -35.5%
4,494,674 613,187 -3,881,487 -86.4%
application/pdf 10,281,663 7,097,717 -3,183,946 -31.0%
application/javascript 39,019 1,511,594 1,472,575 3774.0%
text/css 841,105 1,973,508 1,132,403 134.6%
text/xml 344,748 1,433,159 1,088,411 315.7%
unk 4,326 818,619 814,293 18823.2%
application/rss+xml 64,280 731,253 666,973 1037.6%
application/x-javascript 622,958 1,232,306 609,348 97.8%
application/vnd.ms-excel 734,077 212,605 -521,472 -71.0%
text/javascript 69,340 481,701 412,361 594.7%
video/x-ms-asf 26,978 372,565 345,587 1281.0%
application/msword 563,161 236,716 -326,445 -58.0%
application/x-shockwave-flash 192,018 479,011 286,993 149.5%
application/octet-stream 419,187 191,421 -227,766 -54.3%
application/zip 312,872 92,318 -220,554 -70.5%
application/json 1,268 217,742 216,474 17072.1%
video/x-flv 1,448 180,222 178,774 12346.3%
image/jpg 26,421 172,863 146,442 554.3%
application/postscript 181,795 39,832 -141,963 -78.1%
image/x-icon 45,294 164,673 119,379 263.6%
chemical/x-mopac-input 110,324 1,035 -109,289 -99.1%
application/atom+xml 165,821 269,219 103,398 62.4%
application/xml 145,141 246,857 101,716 70.1%
application/x-cgi 100,813 51 -100,762 -99.9%
audio/mpeg 95,613 179,045 83,432 87.3%
video/mp4 1,887 73,475 71,588 3793.7%

Presented as a set of graphs,  first showing the change in number of instances of a given Media Type between the two archives.

30 Media Types that changed the most

30 Media Types that changed the most

The second graph is the percentage change between the two archives.

% Change in top 30 mimetypes shared between archives

% Change in top 30 media types shared between archives

Things that stand out are the growth of application/javascript between 2008 and 2012,  up 3,774% and application/json that was up over 17,000%.  Two formats used to deliver video grew as well with video/x-flv and video/mp4 increasing 12,346% and 3794% respectively.

There were a number of Media Types that reduced in the number and percentage but they are not as dramatic as those identified above.  Of note is that between 2008 and 2012 there was a decline of 100% in content with a Media Type of application/x-cgi and a 78% decrease in files that were application/postscript.

Working with the Media Types found in large web archives is a bit messy.  While there are standard ways of presenting Media Types to browsers, there are also non-standard, experimental and inaccurate instances of Media Types that will exist in these archives.  It does appear that we can see the introduction of some of the newer technologies between the two different archives.  Technologies such as the adoption of JSON and Javascript based sites as well as new formats of video on the web.

If you have questions or comments about this post,  please let me know via Twitter.

Comparing Web Archives: EOT2008 and EOT2012 – When

In 2008 a group of institution comprised of the Internet Archive, Library of Congress, California Digital Library, University of North Texas, and Government Publishing Office worked together to collect the web presence of the federal government in a project that has come to be known as the End of Term Presidential Harvest 2008.

Working together this group established the scope of the project, developed a tool to collect nominations of URLs important to the community for harvesting, carried out a harvest of the federal web presence before the election, after the election, and after the inauguration of President Obama. This collection was harvested by the Internet Archive, Library of Congress, California Digital Library, and the UNT Libraries.  At the end of the EOT project the data harvested was shared between the partners with several institutions acquiring a copy of the complete EOT dataset for their local collections.

Moving forward four years the same group got together to organize the harvesting of the federal domain in 2012.  While originally scoped as a way of capturing the transition of the executive branch,  this EOT project also served as a way to systematically capture a large portion of the federal web on a four year calendar.  In addition to the 2008 partners,  Harvard joined in the project for 2012.

Again the team worked to identify in-scope content to collect, this time however the content included URLs from the social web including Twitter and Facebook for agencies, offices and individuals in the federal government.  Because there was not a change in office because of the 2012 election, there was just a set of crawls that occurred during the fall of 2012 and the winter of 2013.  Again this content was shared between the project partners interested in acquiring the archives for their own collections.

The End of Term group is a loosely organized group that comes together ever four years to conduct the harvesting of the federal web presence. As we ramp up for the end of the Obama administration the group has started to plan the EOT 2016 project with a goal to start crawling in September of 2016.  This time there will be a new president so the crawling will probably take the format of the 2008 crawls with a pre-election, post-election and post-inauguration set of crawls.

So far there hasn’t been much in the way of analysis to compare the EOT2008 and EOT2012 web archives.  There are a number of questions that have come up over the years that remain unanswered about the two collections.  This series of posts will hopefully take a stab at answering some of those questions and maybe provide better insight into the makeup of these two collections.  Finally there are hopefully a few things that can be learned from the different approaches used during the creation of these archives that might be helpful as we begin the EOT 2016 crawling.

Working with the EOT Data

The dataset that I am working with for these posts consists of the CDX files created for the EOT2008 and EOT2012 archive.  Each of the CDX files acts as an index to the raw archived content and contains a number of fields that can be useful for analysis.  All of the archive content is referenced in the CDX file.

If you haven’t looked at a CDX file in the past here is an example of a CDX file.

gov,loc)/jukebox/search/results?count=20&fq[0]=take_vocal_id:farrar,%20geraldine&fq[1]=take_vocal_id:martinelli,%20giovanni&page=1&q=geraldine%20farrar&referrer=/jukebox/ 20121125005312 http://www.loc.gov/jukebox/search/results?count=20&fq%5B0%5D=take_vocal_id%3AFarrar%2C+Geraldine&fq%5B1%5D=take_vocal_id%3AMartinelli%2C+Giovanni&page=1&q=geraldine+farrar&referrer=%2Fjukebox%2F text/html 200 LFN2AKE4D46XEZNOP3OLXG2WAPLEKZKO - - - 533010532 LOC-EOT2012-001-20121125003355718-04184-15895~wbgrp-crawl012.us.archive.org~8443.warc.gz
gov,loc)/jukebox/search/results?count=20&fq[0]=take_vocal_id:farrar,%20geraldine&fq[1]=take_vocal_id:schumann-heink,%20ernestine&page=1&q=geraldine%20farrar&referrer=/jukebox/ 20121125005219 http://www.loc.gov/jukebox/search/results?count=20&fq%5B0%5D=take_vocal_id%3AFarrar%2C+Geraldine&fq%5B1%5D=take_vocal_id%3ASchumann-Heink%2C+Ernestine&page=1&q=geraldine+farrar&referrer=%2Fjukebox%2F text/html 200 EL5OT5NAXGGV6VADBLNP2CBZSZ5MH6OT - - - 531160983 LOC-EOT2012-001-20121125003355718-04184-15895~wbgrp-crawl012.us.archive.org~8443.warc.gz
gov,loc)/jukebox/search/results?count=20&fq[0]=take_vocal_id:farrar,%20geraldine&fq[1]=take_vocal_id:scotti,%20antonio&page=1&q=geraldine%20farrar&referrer=/jukebox/ 20121125005255 http://www.loc.gov/jukebox/search/results?count=20&fq%5B0%5D=take_vocal_id%3AFarrar%2C+Geraldine&fq%5B1%5D=take_vocal_id%3AScotti%2C+Antonio&page=1&q=geraldine+farrar&referrer=%2Fjukebox%2F text/html 200 SEFDA5UNFREPA35QNNLI7DPNU3P4WDCO - - - 804325022 LOC-EOT2012-001-20121125003257404-04183-15895~wbgrp-crawl012.us.archive.org~8443.warc.gz
gov,loc)/jukebox/search/results?count=20&fq[0]=take_vocal_id:farrar,%20geraldine&fq[1]=take_vocal_id:viafora,%20gina&page=1&q=geraldine%20farrar&referrer=/jukebox/ 20121125005309 http://www.loc.gov/jukebox/search/results?count=20&fq%5B0%5D=take_vocal_id%3AFarrar%2C+Geraldine&fq%5B1%5D=take_vocal_id%3AViafora%2C+Gina&page=1&q=geraldine+farrar&referrer=%2Fjukebox%2F text/html 200 EV6N3TMKIVWAHEHF54M2EMWVM5DP7REJ - - - 532966964 LOC-EOT2012-001-20121125003355718-04184-15895~wbgrp-crawl012.us.archive.org~8443.warc.gz
gov,loc)/jukebox/search/results?count=20&fq[0]=take_vocal_id:homer,%20louise&fq[1]=take_composer_name:campana,%20f.%20&page=1&q=geraldine%20farrar&referrer=/jukebox/ 20121125070122 http://www.loc.gov/jukebox/search/results?count=20&fq%5B0%5D=take_vocal_id%3AHomer%2C+Louise&fq%5B1%5D=take_composer_name%3ACampana%2C+F.+&page=1&q=geraldine+farrar&referrer=%2Fjukebox%2F text/html 200 FW2IGVNKIQGBUQILQGZFLXNEHL634OI6 - - - 661008391 LOC-EOT2012-001-20121125064213479-04227-15895~wbgrp-crawl012.us.archive.org~8443.warc.gz

The CDX format is a space delimited file with the following fields

  • SURT formatted URI
  • Capture Time
  • Original URI
  • MIME Type
  • Response Code
  • Content Hash (SHA1)
  • Redirect URL
  • Meta tags (not populated)
  • Compressed length (sometimes populated)
  • Offset in WARC file
  • WARC File Name

The tools I’m working with to analyze the EOT datasets will consist of Python scripts that either extract specific data from the CDX files where it can be further sorted and counted, or they will be scripts that work on these sorted and counted versions of files.

I’m trying to post code and derived datasets in a Github repository called eot-cdx-analysis if you are interested in taking a look.  There is also a link to the original CDX datasets there as well.

How much

The EOT2008 dataset consists of 160,212,141 URIs and the EOT2012 dataset comes in at 194,066,940 URIs.  Unfortunately the CDX files that we are working with don’t have consistent size information that we can use for analysis but the rough sizes for each of the archives is EOT2008 at 16TB and EOT2012 at just over 41.6TB.

When

The first dimension I wanted to look at was when was the content harvested for each of the EOT rounds.  In both cases we all remember starting the harvesting “sometime in September” and then ending the crawls “sometime in March” of the following year.  How close were we to our memory?

For this I extracted the Capture Time field from the CDX file, converted that into a date yyyy–mm-dd was a decent bucket to group into and then sorted and counted each instance of a date.

EOT2008 Harvest Dates

EOT2008 Harvest Dates

This first chart shows the harvest dates contained in the EOT2008 CDX files.  Things got kicked off in September 2008 and apparently concluded all the way in OCT 2009.  There is another blip of activity in May of 2009.  This is probably something to go back and look at to help remember what exactly these two sets of crawling were that happened after March 2009 when we all seem to remember crawling stopping.

EOT2012 Harvest Dates

EOT2012 Harvest Dates

The EOT2012 crawling started off in mid-September and this time finished up in the first part of March 2013.  There is a more consistent shape to the crawling for this EOT with a pretty consistent set of crawling happening between mid-October and the end of January.

EOT2008 and EOT2012 Harvest Dates Compared

EOT2008 and EOT2012 Harvest Dates Compared

When you overlay the two charts you can see how the two compare.  Obviously the EOT2008 data continues quite a bit further than the EOT2012 but where they overlap you can see that there were different patterns to the collecting.

Closing

This is the first of a few posts related to web archiving and specifically to comparing the EOT2008 and EOT2012 archives.  We are approaching the time to start the EOT2016 crawls and it would be helpful to have more information about what we crawled in the two previous cycles.

In addition to just needing to do this work there will be a presentation on some of these findings as well as other types of analysis at the 2016 Web Archiving and Digital Libraries (WADL) workshop that is happening at the end of JCDL2016 this year in Newark, NJ.

If there are questions you have about the EOT2008 or EOT2012 archives please get in contact with me and we can see if we can answer them.

If you have questions or comments about this post,  please let me know via Twitter.