This post is just an overview of the 2016 year for the UNT Libraries’ Digital Collections. I have wanted to do one of these for a number of years now but never really got around to it. So here we go.
I plan to look at two areas of activity for the digital collections. Content added, usage, and some info on metadata curation activities. This first post will focus on items added.
Items added
From January 1, 2016 until December 31, 2016 we added a total of 295,077 new items to the UNT Libraries’ Digital Collections. The UNT Libraries’ Digital Collections encompasses The Portal to Texas History, the UNT Digital Library, and the Gateway to Oklahoma History. The graphic below shows the number of records added to each of the systems throughout the year.
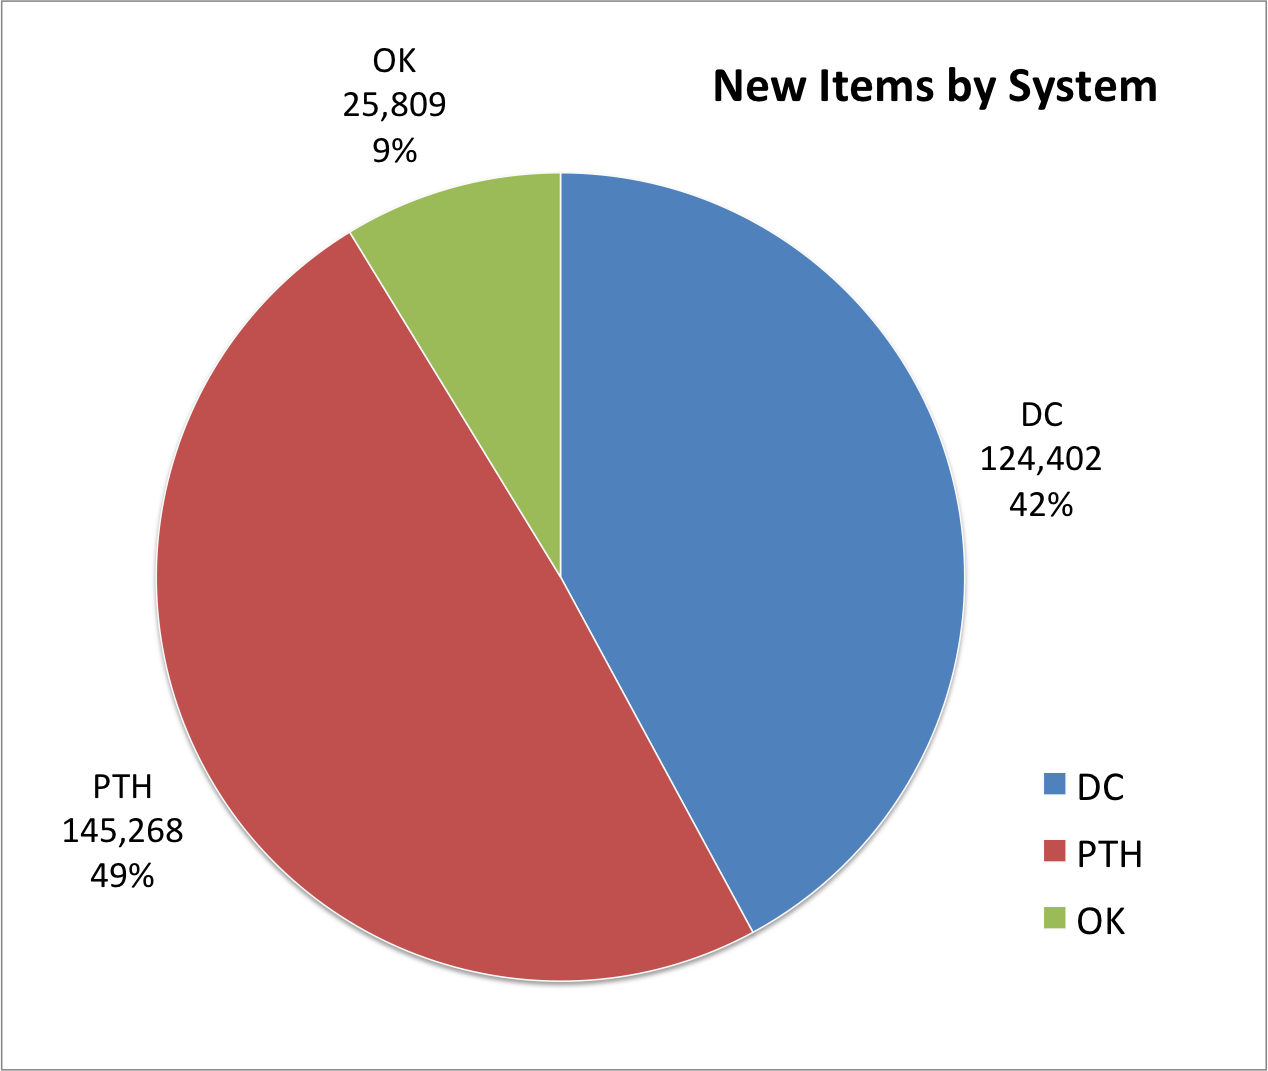
Items Added by System
The Portal to Texas History (PTH in the chart) had the most items added at 145,268 new items. This was followed by the UNT Digital Library (DC in the chart) with 124,402 items and finally the Gateway to Oklahoma History (OK in the chart) with 25,809 new items.
If you look at files (often ‘pages’) instead of items the graph will change a bit.
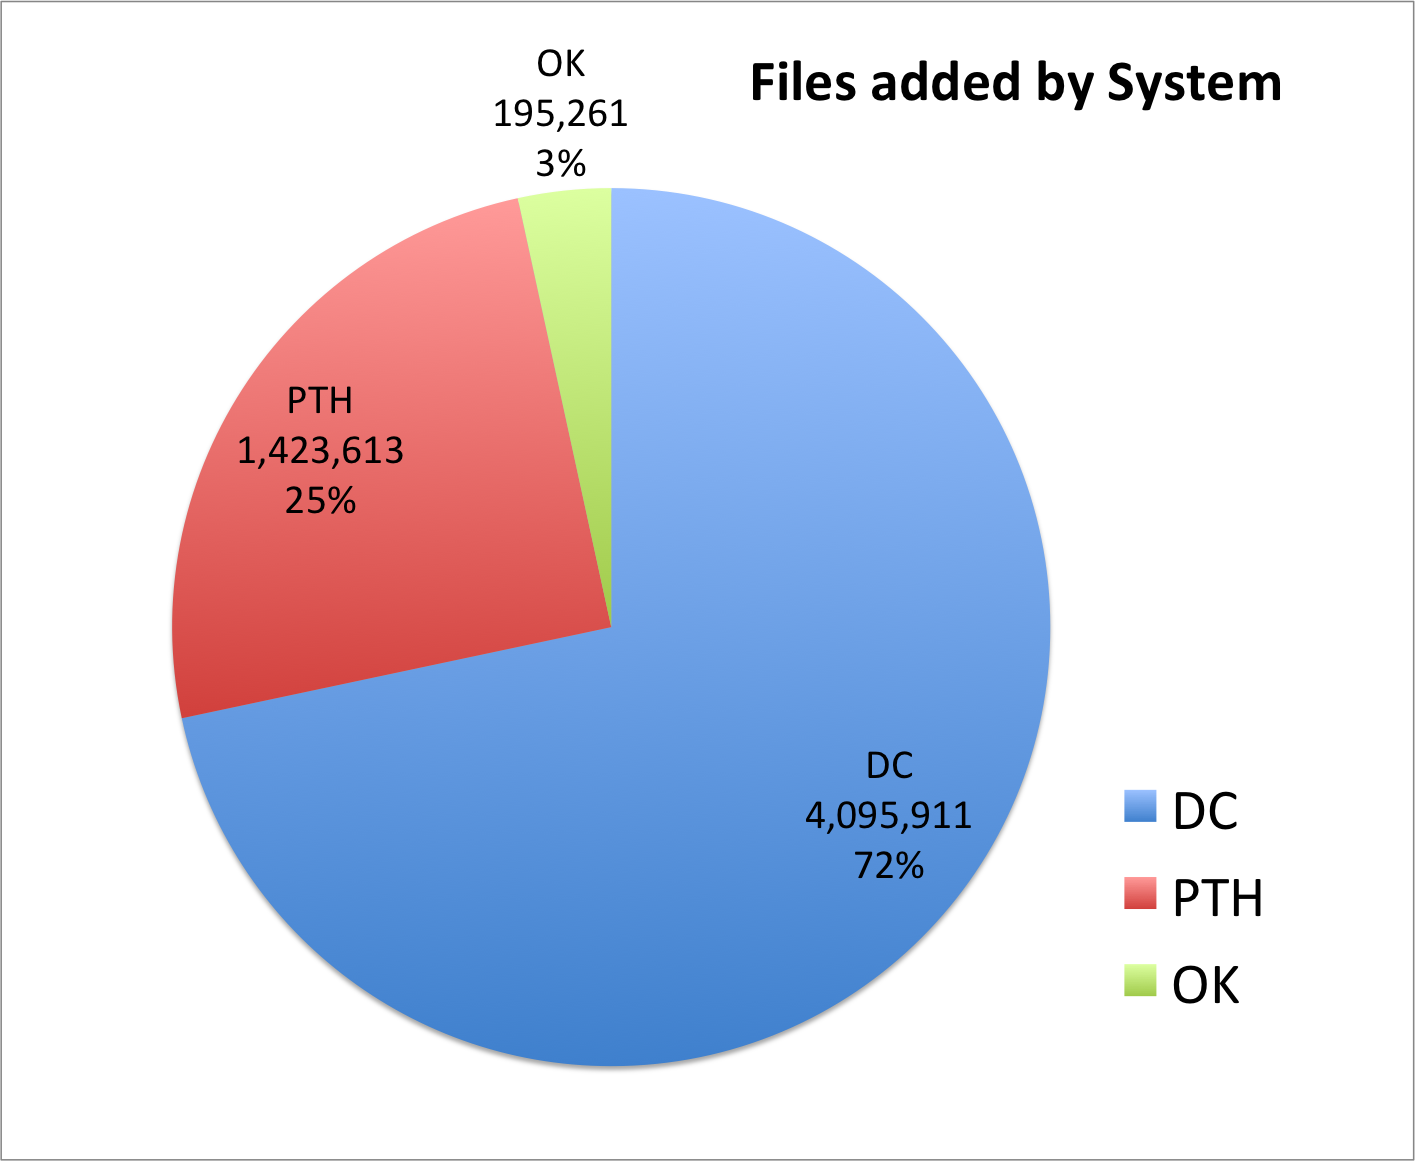
New Pages by System
While we added the most items to The Portal to Texas History, we added the most pages of content to the UNT Digital Library. In total we added 5,704,046 files to the Digital Collections in 2016.
Added by Date
The number of items added per month is a good way of getting an overview of activity across the year. The graphic below presents that data.
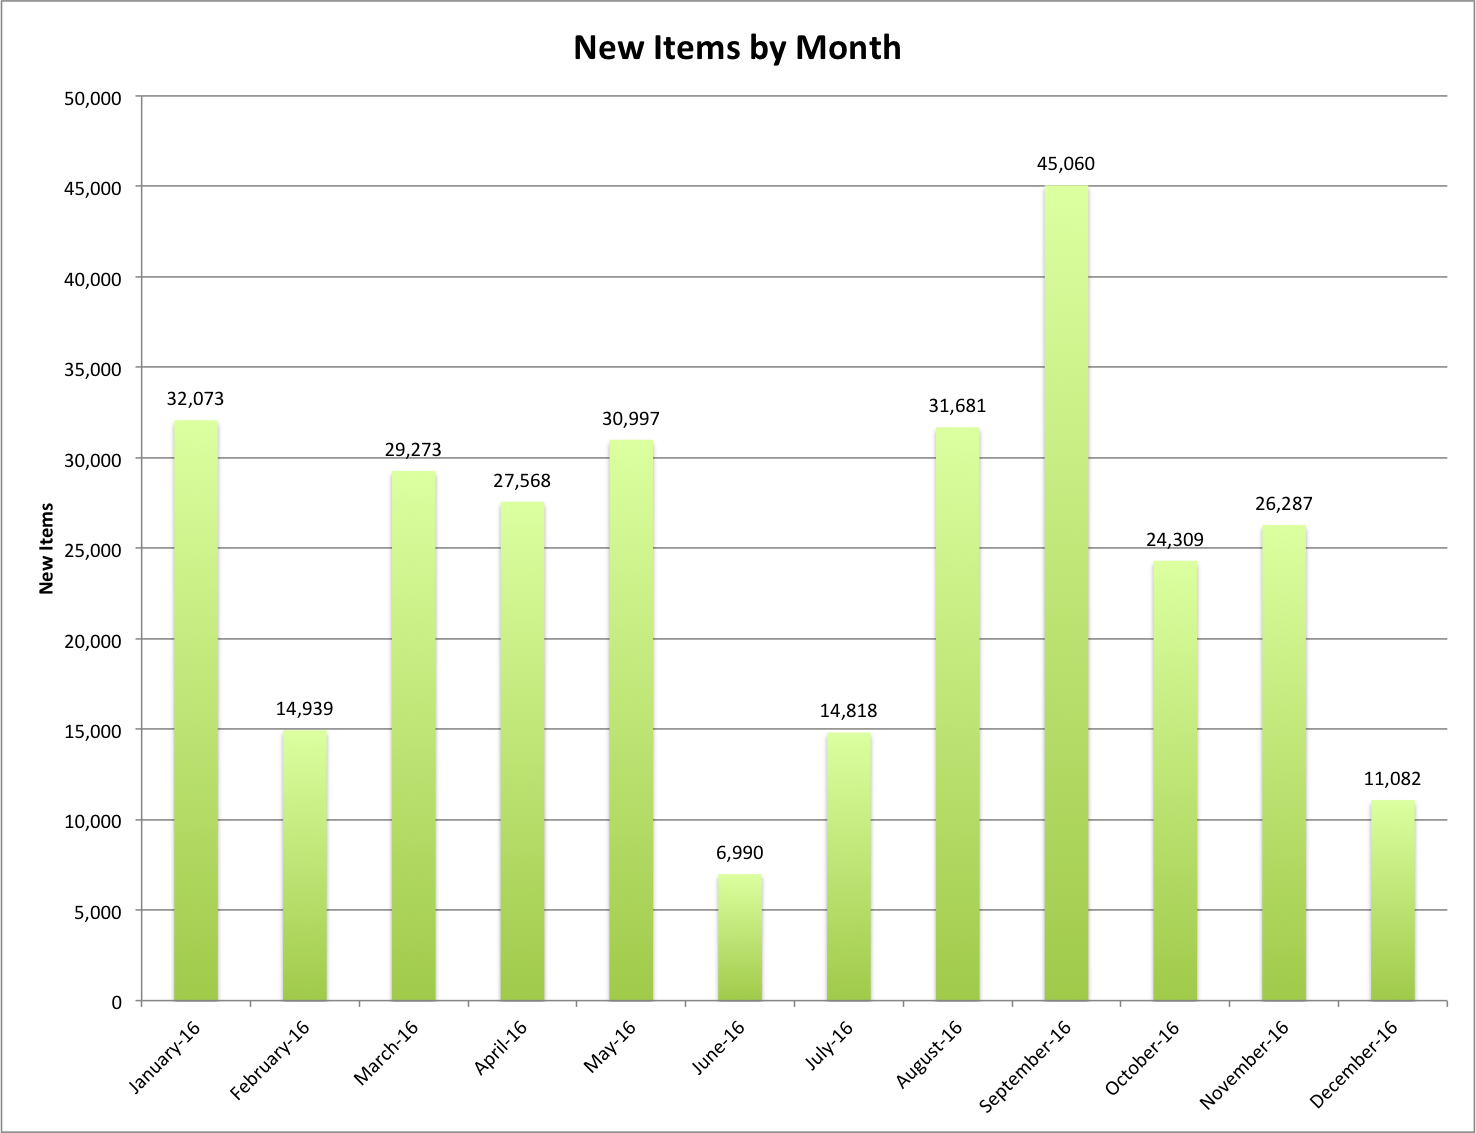
New Items By Month
The average number of items added per months is 24,590 which is a very respectable number. When you look at the number of items added on a given day during the year, the graph is a bit harder to read but you can see some days that had quite a bit of data loading going on.
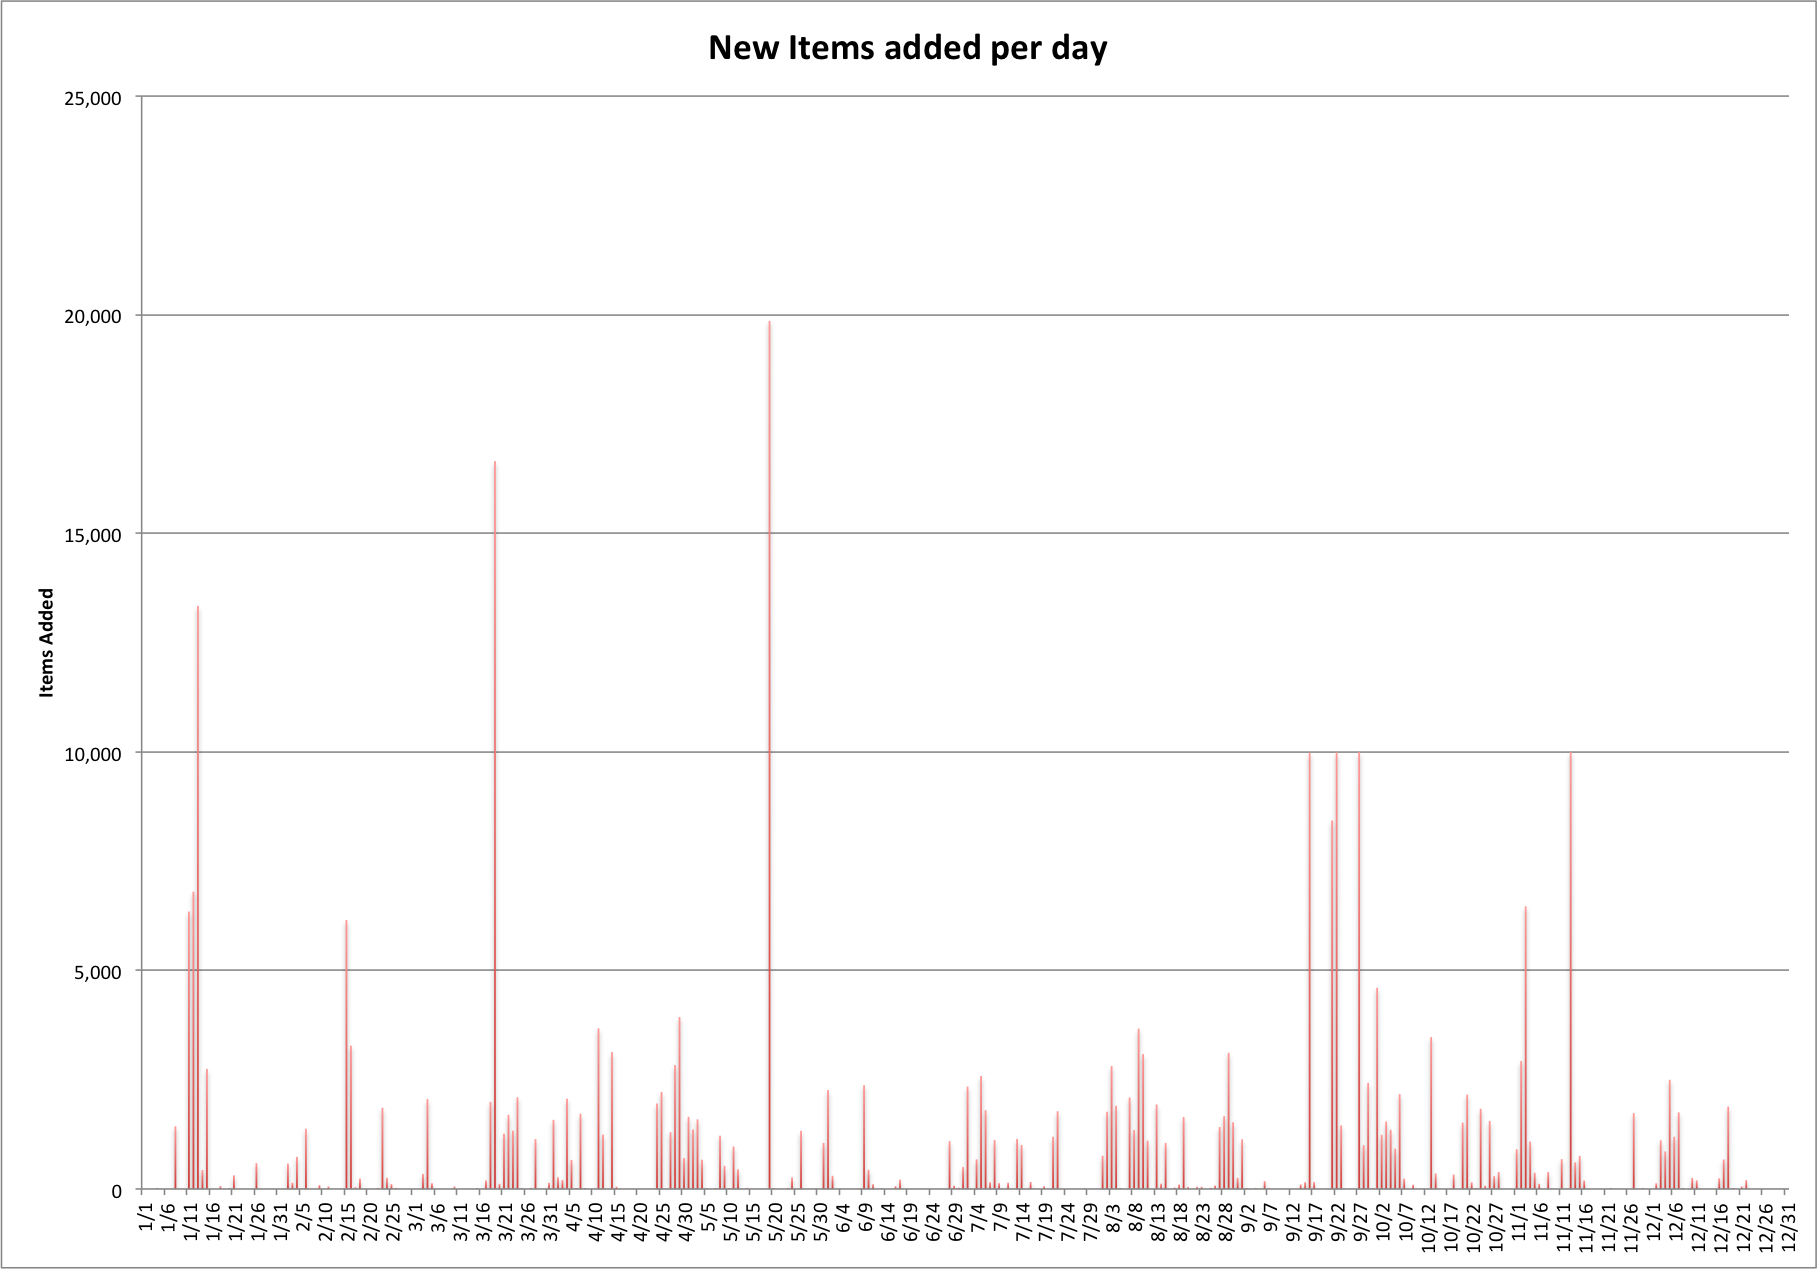
New Items Added Per Day
As you can see it is a bit harder to tell what is going on. some days of note include May 19th that had 19,858 items processed and uploaded, March 19th with 16,649, and January 13th with 13,338 new items added. there are at least six other days with over 10,000 items processed and added to the digital collections.
If you take the number of items and spread them across the entire year you will get an average of 808 items loaded into the system per day. Not bad at all. There were actually 165 days during 2016 that there weren’t any items added to the Digital Collections which leaves an impressive 200 days that new content was being processed and loaded. When you remove weekends you are left with content being added almost four days a week.
Another fun number to think about is that if we added an average of 808 items per day during 2016. That’s 33.6 items added per hour during the day, for just about one item created and added every thirty seconds.
Items by Type
Next up is to take a look at what kind of items were added throughout the year. I’m going to base these numbers off of the resource type field for each of the records. If for some reason the item doesn’t have a resource type set then it will have a value of None.
| Resource Type | Item Count | % of Total |
| text_newspaper | 124,662 | 42.25% |
| text_report | 56,279 | 19.07% |
| image_photo | 42,203 | 14.30% |
| text_article | 31,129 | 10.55% |
| video | 12,238 | 4.15% |
| text_script | 7,230 | 2.45% |
| sound | 4,956 | 1.68% |
| image_drawing | 4,097 | 1.39% |
| text_etd | 2,763 | 0.94% |
| text | 2,365 | 0.80% |
| text_leg | 1,433 | 0.49% |
| image_postcard | 1,193 | 0.40% |
| text_journal | 886 | 0.30% |
| text_book | 858 | 0.29% |
| text_pamphlet | 778 | 0.26% |
| text_letter | 541 | 0.18% |
| None | 523 | 0.18% |
| text_clipping | 174 | 0.06% |
| physical-object | 144 | 0.05% |
| image_presentation | 125 | 0.04% |
| text_legal | 111 | 0.04% |
| text_review | 107 | 0.04% |
| image_poster | 89 | 0.03% |
| text_yearbook | 47 | 0.02% |
| text_paper | 37 | 0.01% |
| dataset | 29 | 0.01% |
| image_map | 22 | 0.01% |
| website | 11 | 0.00% |
| image | 11 | 0.00% |
| image_score | 11 | 0.00% |
| image_artwork | 8 | 0.00% |
| text_chapter | 7 | 0.00% |
| collection | 5 | 0.00% |
| text_poem | 3 | 0.00% |
| interactive-resource | 2 | 0.00% |
I’ve taken the ten most commonly added item types, which account for over 97% of items added to the system and made a little pie chart out of them below.
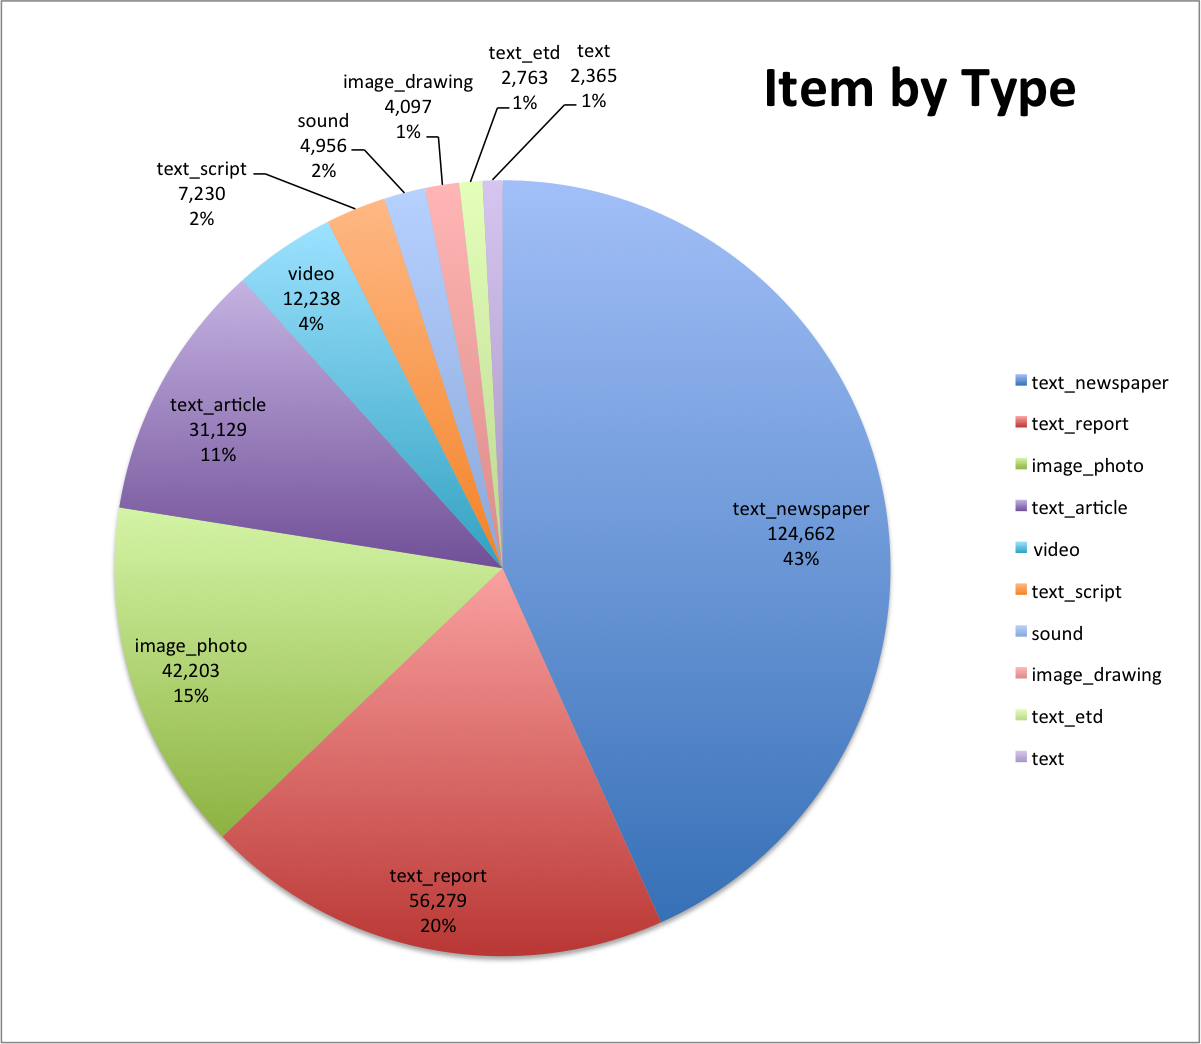
Item by Type
As you can see the Digital Collections added a large number of newspapers over the past year. Newspapers accounted for 124,662 or 43% of new items added to the system. There were a large number of reports, photographs, and articles added as well. Coming in at the fifth most added type are videos of which we added 12,238 new video items.
Items by Partner
Because we work with a number of partners here at UNT, across Texas, and into Oklahoma we upload content into the system associated with one partner. Throughout the year we added items to 154 different partner collections in the UNT Libraries’ Digital Collections. I’ve presented the ten partners that contributed the most content to the collections in 2016.
| Partner | Partner Code | Item Count | Item Percentage |
| UNT Libraries Government Documents Department | UNTGD | 90,393 | 30.63% |
| UNT Libraries’ Special Collections | UNTA | 32,263 | 10.93% |
| Oklahoma Historical Society | OKHS | 25,786 | 8.74% |
| Texas Historical Commission | THC | 25,222 | 8.55% |
| UNT Libraries | UNT | 15,319 | 5.19% |
| Cuero Public Library | CUERPU | 5,901 | 2.00% |
| Nellie Pederson Civic Library | CLIFNE | 5,881 | 1.99% |
| Coleman Public Library | CLMNPL | 5,729 | 1.94% |
| Gladys Johnson Ritchie Library | GJRL | 4,850 | 1.64% |
| Abilene Christian University Library | ACUL | 4,359 | 1.48% |
You can see that we had a strong year for the UNT Libraries’ Government Documents Department that added over 90,000 items to the system. We have been ramping up the digitization activities for the UNT Libraries’ Special Collections and you can see the results with over 32,000 new items being added to the UNT Digital Library.
Closing
I think that’s just about it for the year overview of new content added to the UNT Libraries’ Digital Collections. Next up I’m going to dig into some usage data that was collected from 2016 and see what that can tell us about last year.
I’m quite impressed with the amount of content that we added in 2016. Adding 295,077 to the Digital Collections brought us to 1,751,015 items and 26,326,187 files (pages) of content in the systems. I’m looking forward to 2017 and what it has in store for us. At the rate we added content in 2016 I have a strong feeling that we will be passing the 2 million item mark.
If you have questions or comments about this post, please let me know via Twitter.