This is the second post in a series of posts exploring the metadata from the Digital Public Library of America.
In the first post I introduced the idea of using compressibility of a field as a measure of quality.
This post I wanted to look specifically at the dc.creator field in the DPLA metadata dataset.
DC.Creator Overview
The first thing to do is to give you an overview of the creator field in the DPLA metadata dataset.
As I mentioned in the last post there are a total of 15,816,573 records in the dataset I’m working with. These records are contributed from a wide range of institutions from across the US through Hubs. There are 32 hubs present in the dataset with 102 records that for one reason or another aren’t associated with a hub and which have a “None” for the hub name.
In the graph below you can see how the number of records are distributed across the different hubs.
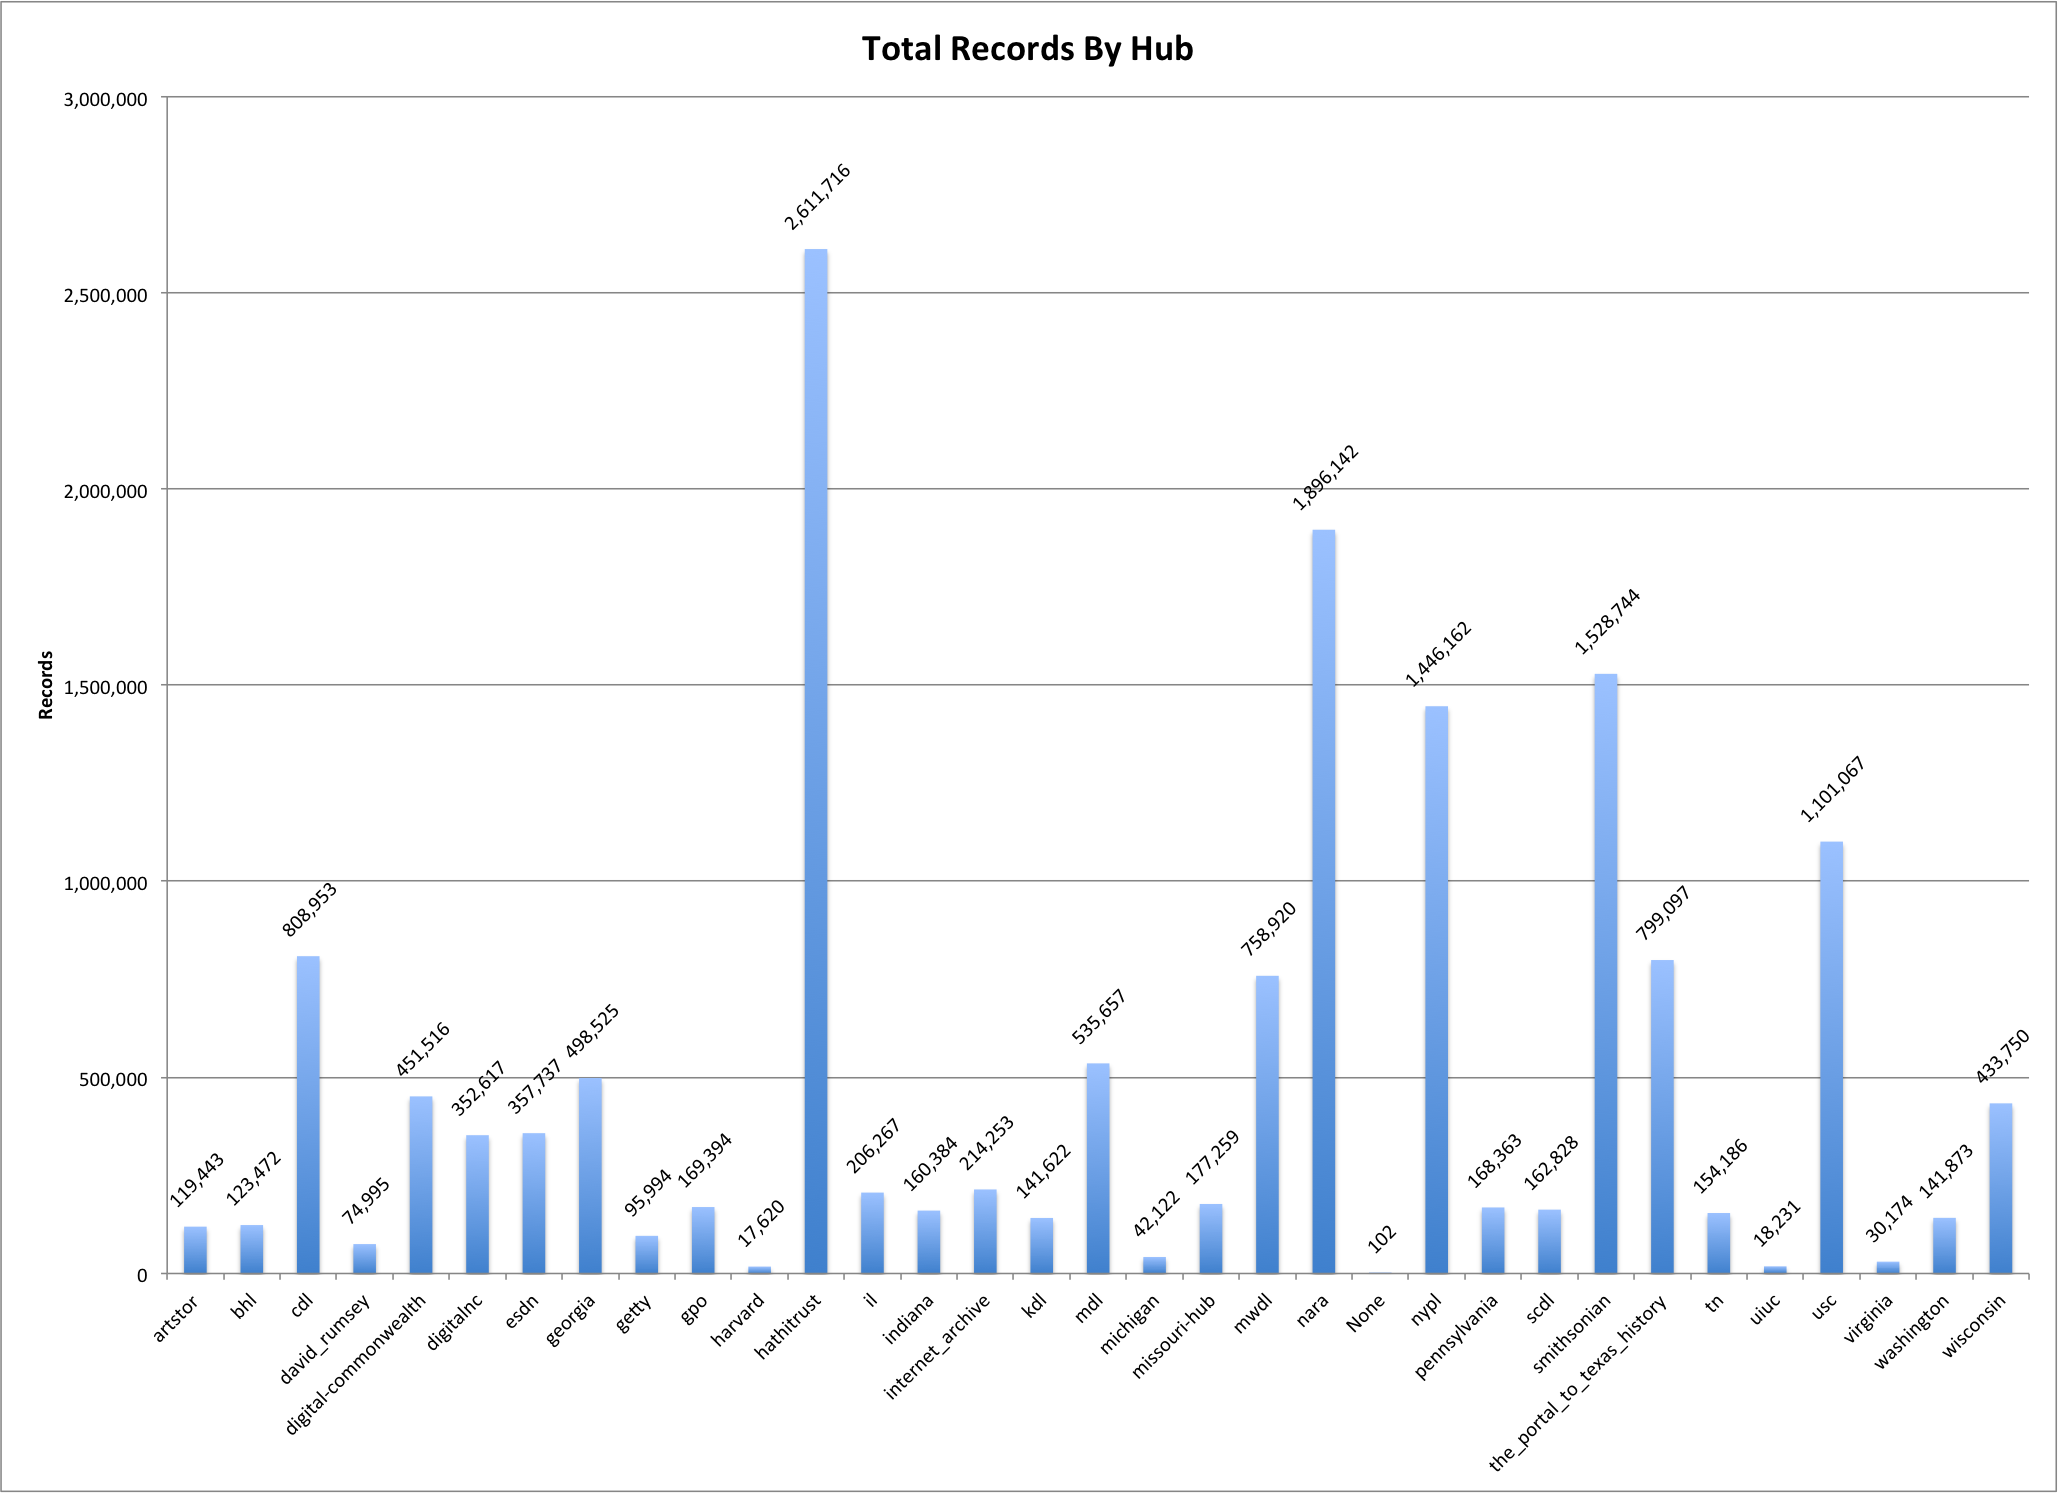
Total Records by Hub
These are similar numbers to what you see in the more up-to-date numbers on the DPLA Partners page.
The next chart shows how the number of records per hub and the number of records with creator values compare.

Total Records and Records with Creators by Hub
You should expect that the red columns in the table above will most often be shorter than the blue columns.
Below is a little bit different way of looking at that same data. This time it is the percentage of records that contain a creator.
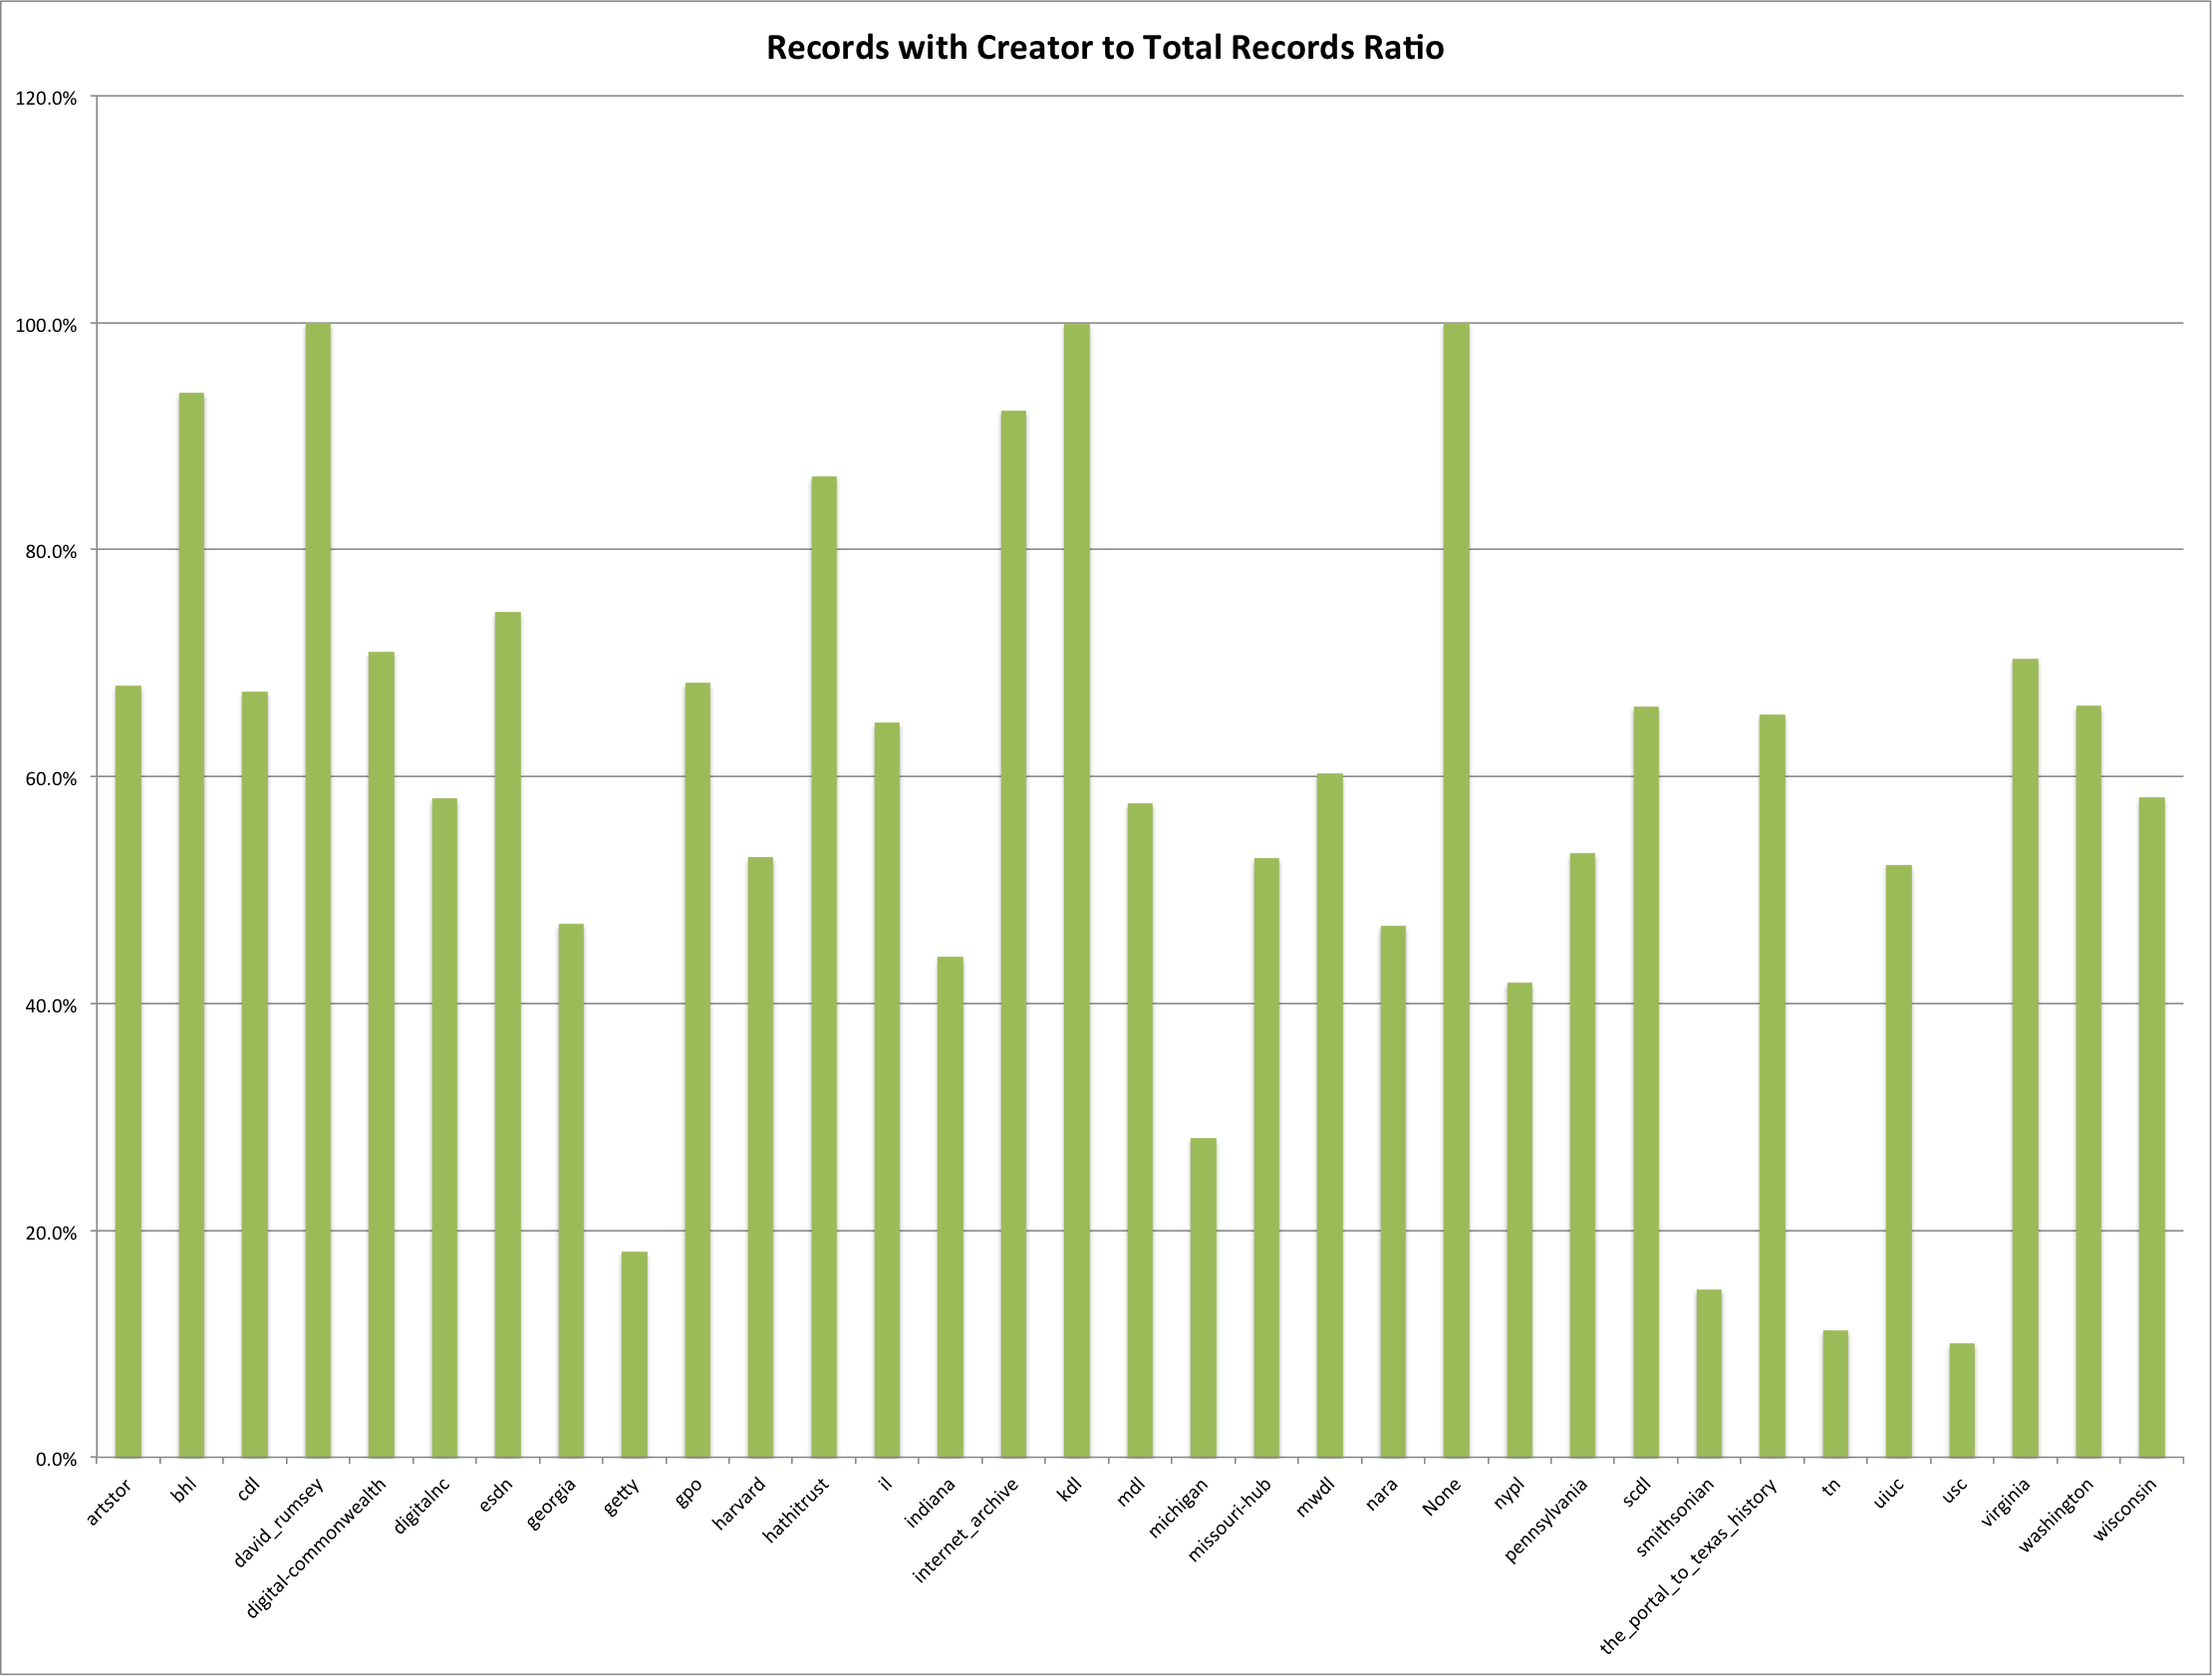
Records with Creator to Total Records
You see that a few of the hubs have almost 100% of their records with a creator, while others have a very low percentage of records with creators.
Looking at the number of records that have a creator value and then the total number of names you can see that some hubs like hathitrust have pretty much a 1 to 1 name to record ratio while others like nara have multiple names per record.
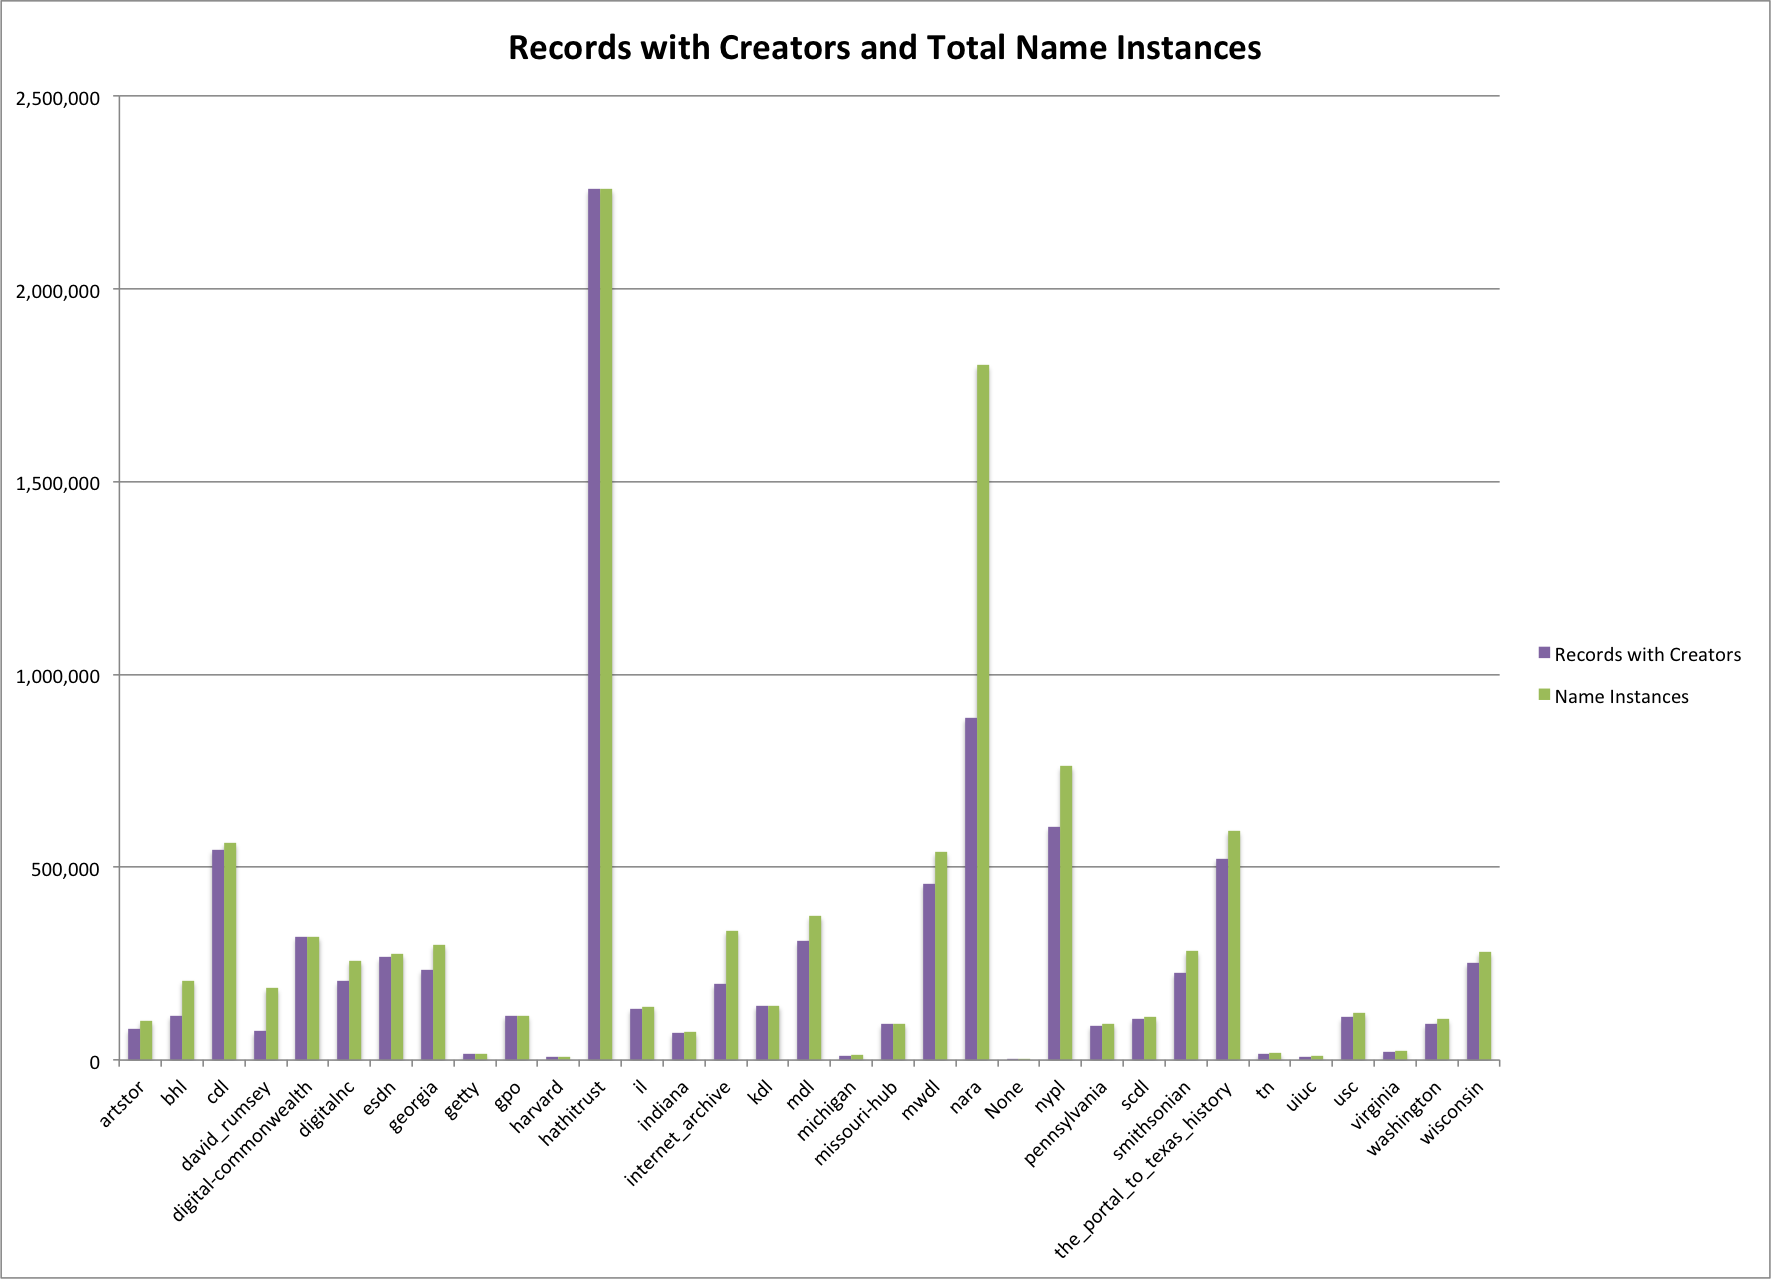
Total Creators and Name Instances
To get an even better sense of this you can look at the average creator/name per record. In this chart you see that david_rumsey has 2.49 creators per record, this is followed by nara at 2.03, bhl with 1.78 and internet_archive at 1.70. There are quite a few (14) hubs that have very close to 1 name per record on average.
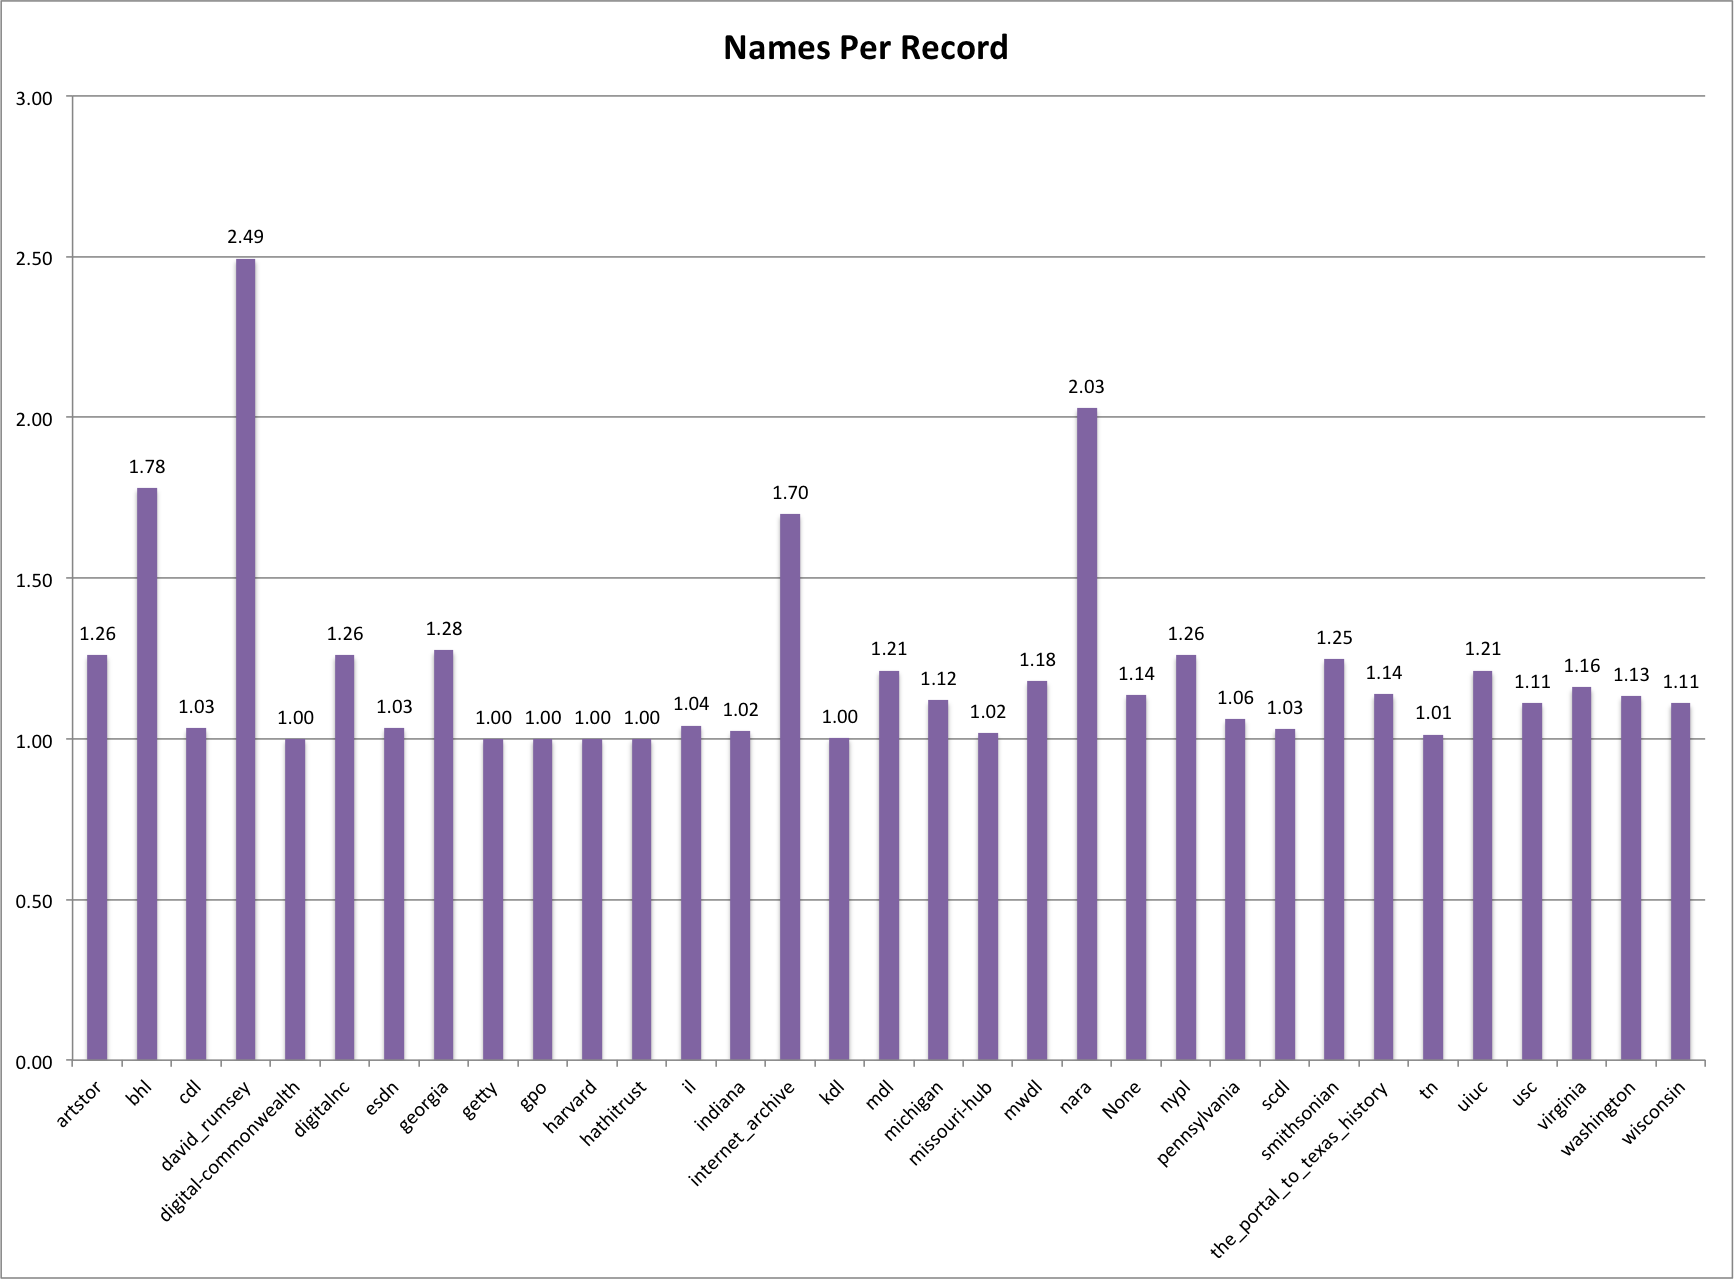
Average Names Per Record
The next thing to look at is the number of unique names per hub. The hathitrust hub sticks out again with the most unique names for a hub in the DPLA.

Unique Creators by Hub
Looking at the ratio between the number of unique names and number of creator instances you can see there is something interesting happening with the nara hub. I put the chart below on a logarithmic scale so you can see things a little better. Notice that nara has a 1,387:1 ratio between the number of unique creators and the creator instances.
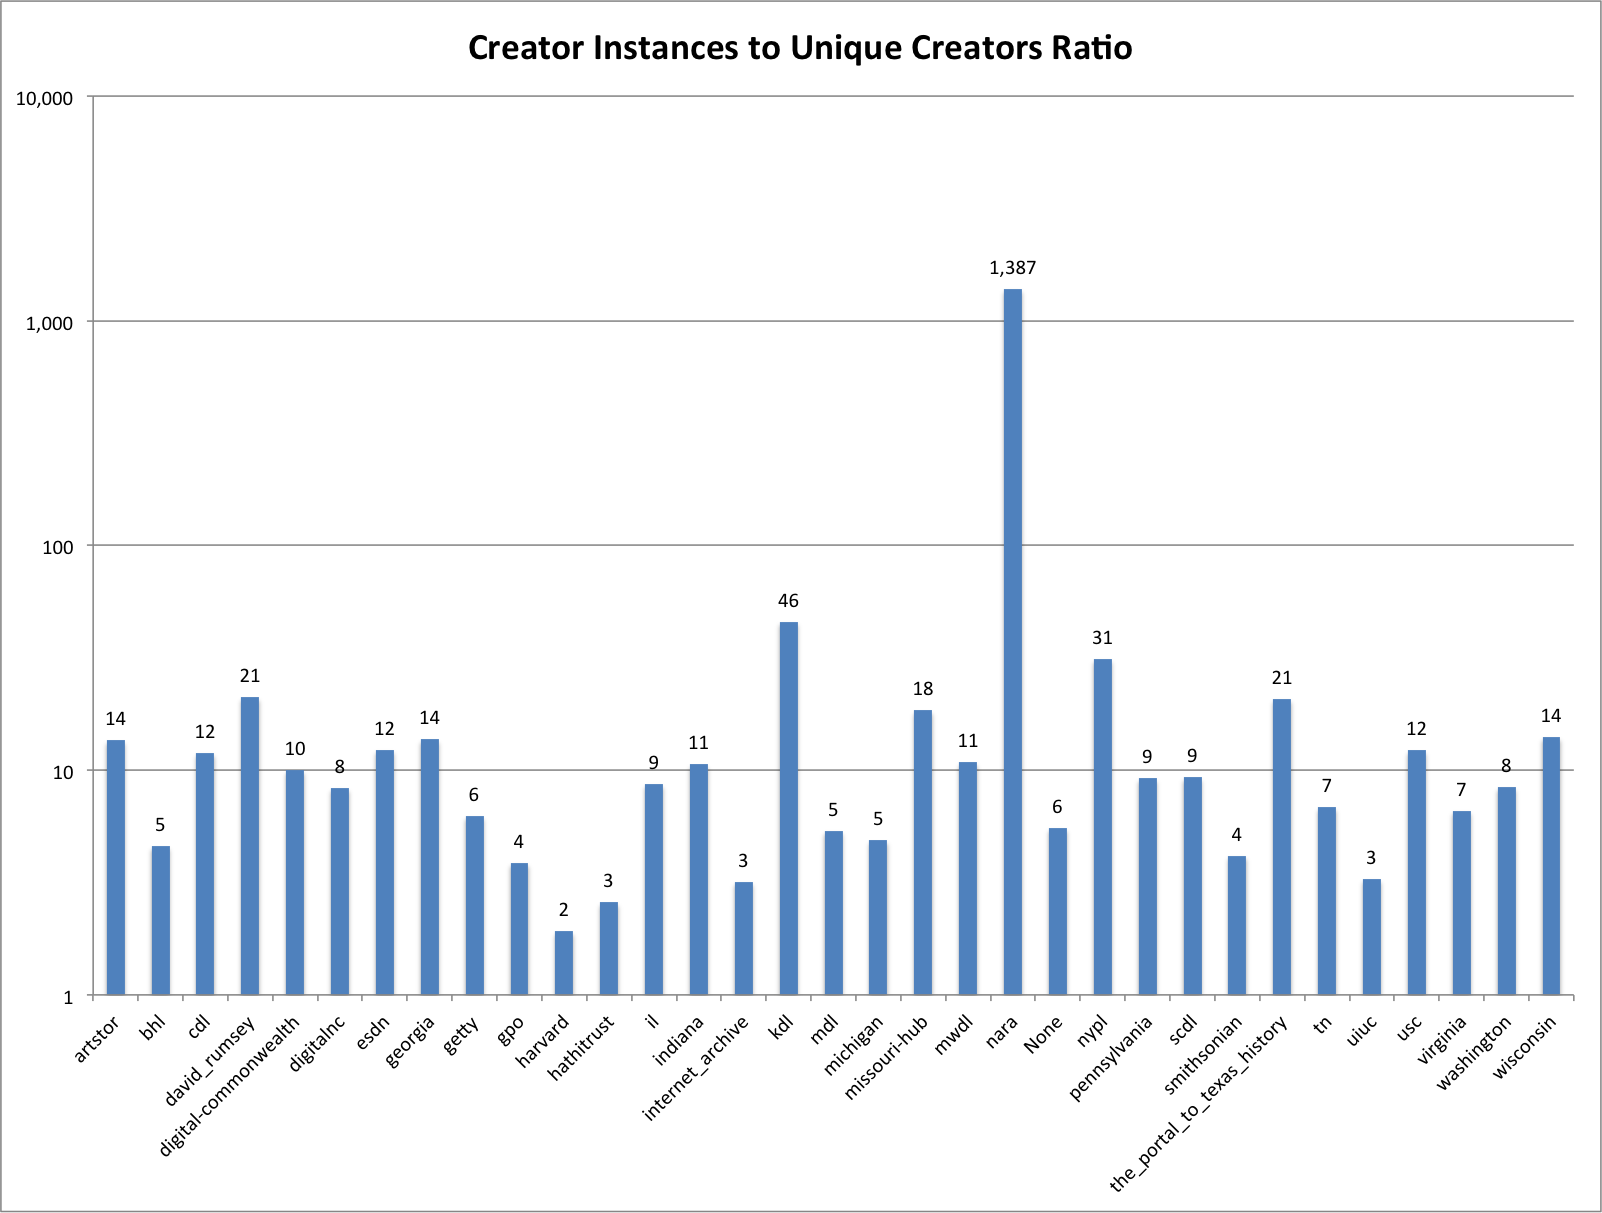
Creator to Unique Ratio
One way to interpret this is to say that the hubs that have the higher ratio have more records that share the same name/creator among records.
Compressibility
Now that we have an overview of the creator field as a whole we want to turn our attention to the compressibility of each of the fields.
I decided to compare the results of four different algorithms, lowercase hash, normalize hash, fingerprint hash, and aggressive fingerprint hash. Below is a table that shows the number of unique values for that field after each of the values has been hashed. You will notice that as you read from left to right the number will go down. This relates to the aggressiveness of the hashing algorithms being used.
| Hub | Unique Names | Lowercase Hash | Normalize Hash | Fingerprint Hash | Aggressive Fingerprint Hash |
| artstor | 7,552 | 7,547 | 7,550 | 7,394 | 7,304 |
| bhl | 44,936 | 44,927 | 44,916 | 44,441 | 42,960 |
| cdl | 47,241 | 46,983 | 47,209 | 45,681 | 44,676 |
| david_rumsey | 8,861 | 8,843 | 8,859 | 8,488 | 8,375 |
| digital-commonwealth | 32,028 | 32,006 | 32,007 | 31,783 | 31,568 |
| digitalnc | 31,016 | 30,997 | 31,006 | 30,039 | 29,730 |
| esdn | 22,401 | 22,370 | 22,399 | 21,940 | 21,818 |
| georgia | 21,821 | 21,792 | 21,821 | 21,521 | 21,237 |
| getty | 2,788 | 2,787 | 2,787 | 2,731 | 2,724 |
| gpo | 29,900 | 29,898 | 29,898 | 29,695 | 29,587 |
| harvard | 4,865 | 4,864 | 4,855 | 4,845 | 4,829 |
| hathitrust | 876,773 | 872,702 | 856,703 | 838,848 | 780,433 |
| il | 16,014 | 15,971 | 15,983 | 15,569 | 15,409 |
| indiana | 6,834 | 6,825 | 6,832 | 6,692 | 6,650 |
| internet_archive | 105,381 | 105,302 | 104,820 | 102,390 | 99,729 |
| kdl | 3,098 | 3,096 | 3,098 | 3,083 | 3,066 |
| mdl | 69,617 | 69,562 | 69,609 | 69,013 | 68,756 |
| michigan | 2,725 | 2,715 | 2,723 | 2,676 | 2,675 |
| missouri-hub | 5,160 | 5,154 | 5,160 | 5,070 | 5,039 |
| mwdl | 49,836 | 49,724 | 49,795 | 48,056 | 47,342 |
| nara | 1,300 | 1,300 | 1,300 | 1,300 | 1,249 |
| None | 21 | 21 | 21 | 21 | 21 |
| nypl | 24,406 | 24,406 | 24,388 | 23,462 | 23,130 |
| pennsylvania | 10,350 | 10,318 | 10,349 | 10,056 | 9,914 |
| scdl | 11,976 | 11,823 | 11,973 | 11,577 | 11,368 |
| smithsonian | 67,941 | 67,934 | 67,826 | 67,242 | 65,705 |
| the_portal_to_texas_history | 28,686 | 28,653 | 28,662 | 28,154 | 28,066 |
| tn | 2,561 | 2,556 | 2,561 | 2,487 | 2,464 |
| uiuc | 3,524 | 3,514 | 3,522 | 3,470 | 3,453 |
| usc | 10,085 | 10,061 | 10,071 | 9,872 | 9,785 |
| virginia | 3,732 | 3,732 | 3,732 | 3,731 | 3,681 |
| washington | 12,674 | 12,642 | 12,669 | 12,184 | 11,659 |
| wisconsin | 19,973 | 19,954 | 19,960 | 19,359 | 19,127 |
Next I will work through each of the hashing algorithms and look at the compressibility of each field after the given algorithm has been applied.
Lowercase Hash: This hashing algorithm will convert all uppercase characters to lowercase and leave all lowercase characters unchanged. The result of this is generally very low amounts of compressibility for each of the hubs. You can see this in the chart below.
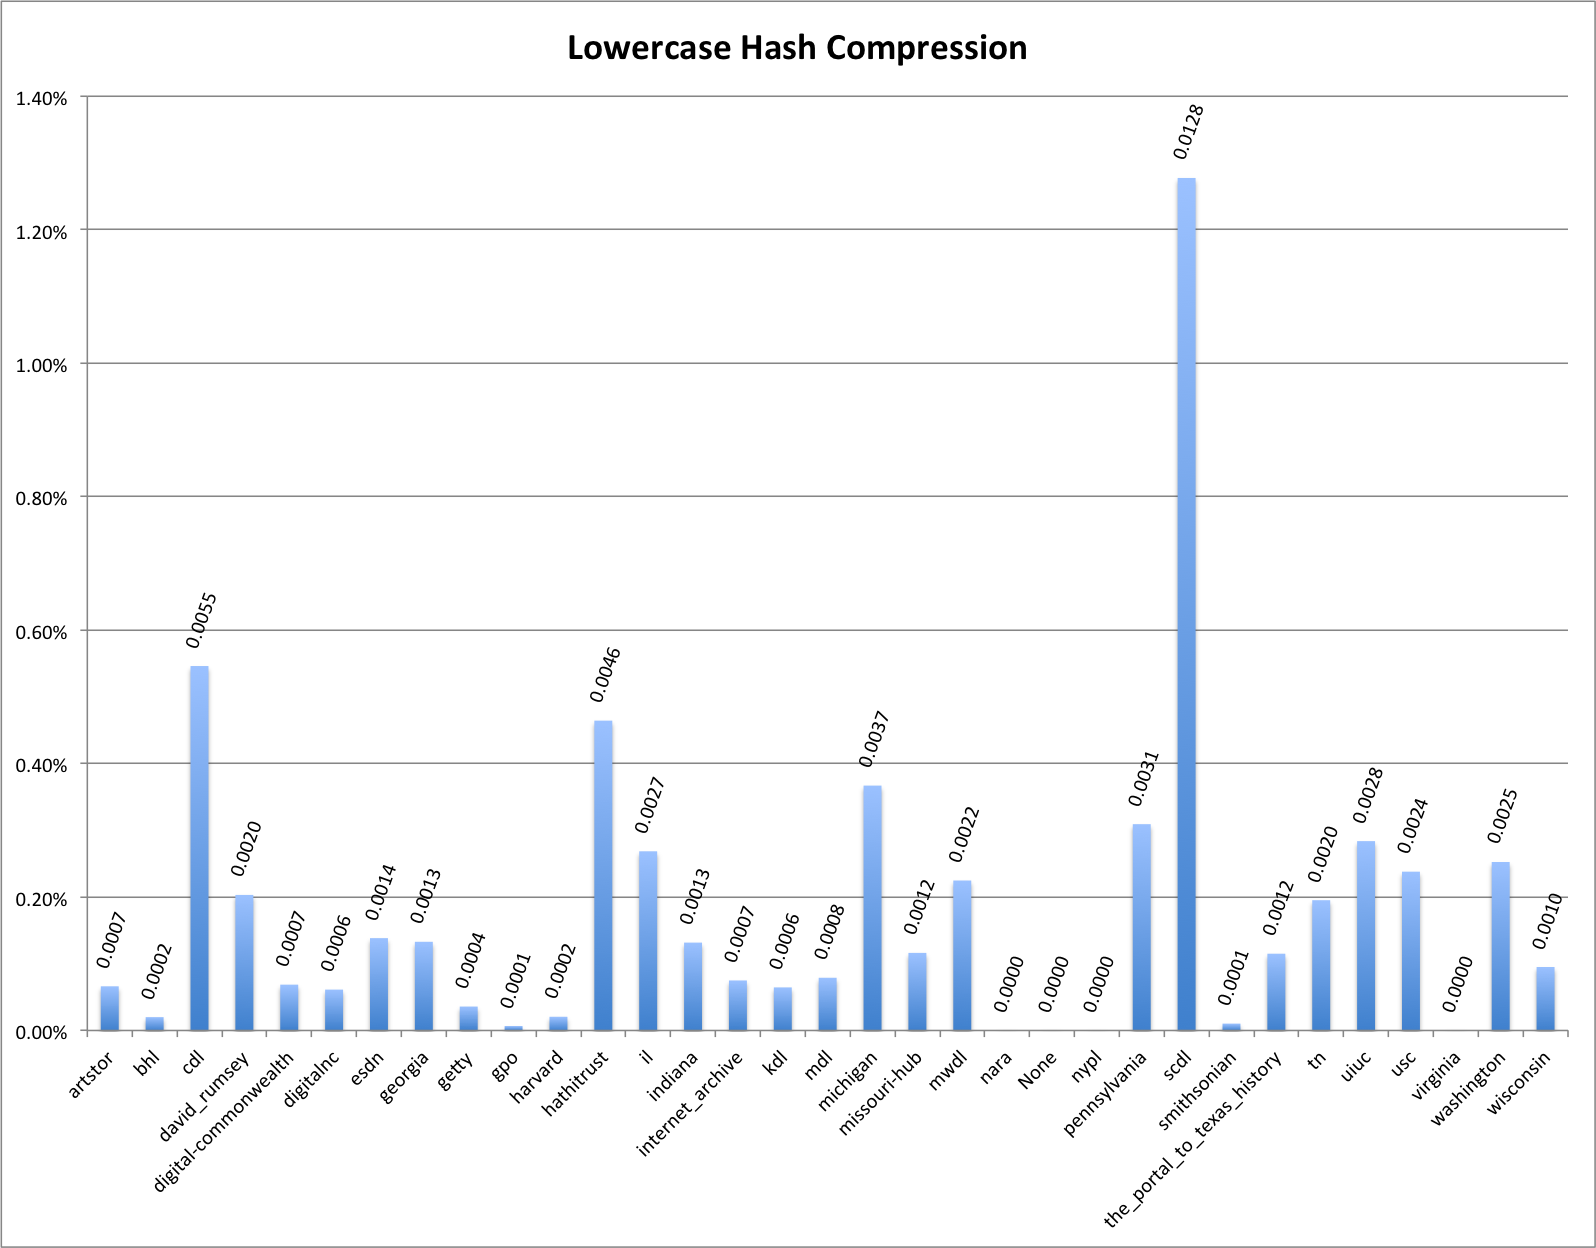
Lowercase Hash Compressibility
Normalize Hash: This has just converts characters down to their ascii equivalent. For example it converts gödel to godel. The compressibility results of this hashing function are quite a bit different than the lowercase hash from above. You see that hathitrust has 2.3% compressibility of its creator names.
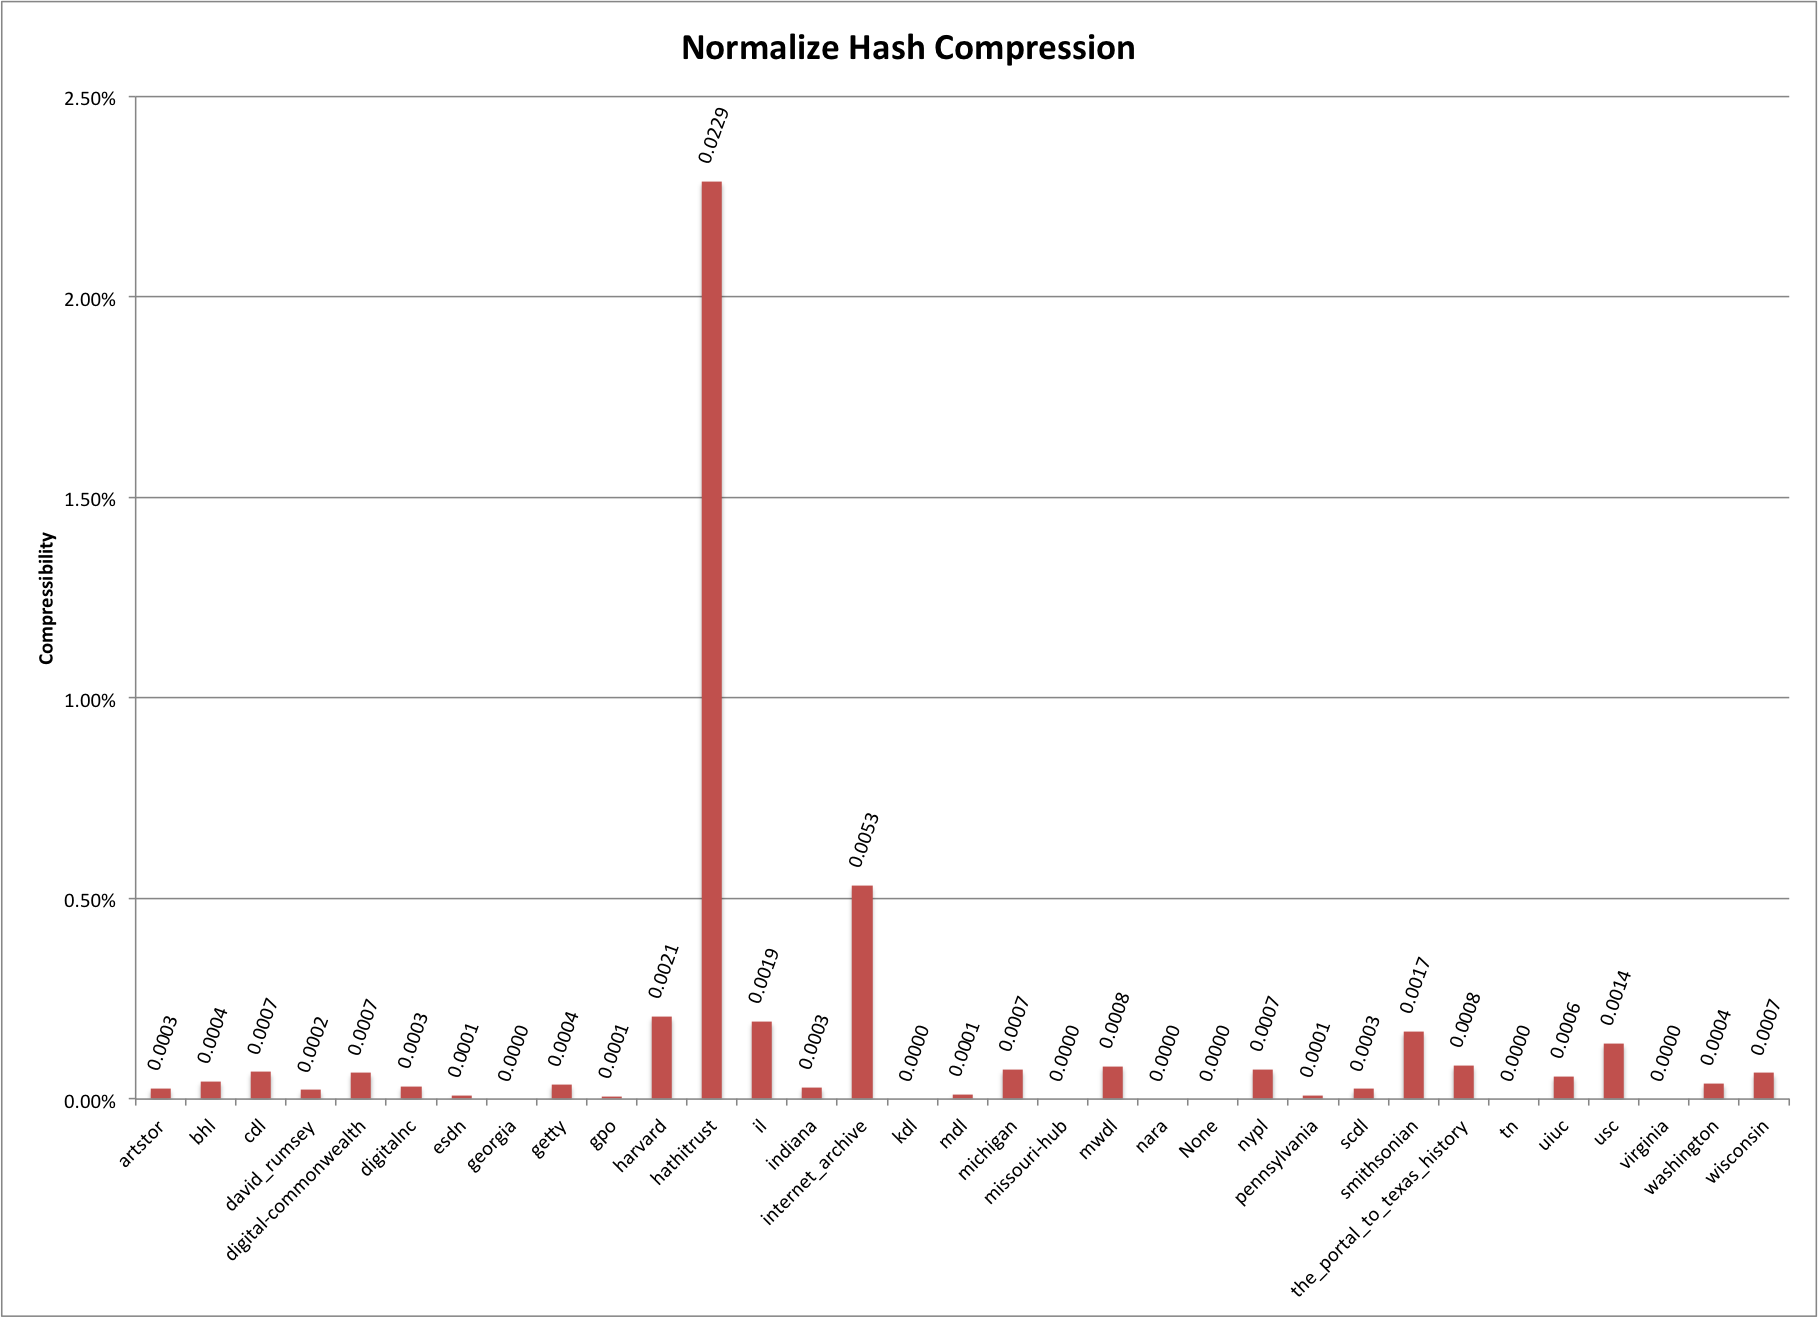
Normalize Hash Compressibility
Fingerprint Hash: This uses the algorithm that OpenRefine describes in depth here. In the algorithm it incorporates a lowercase function as well as a normalize function in the overall process. You can see that there is a bit more consistency between the different compressibility values.
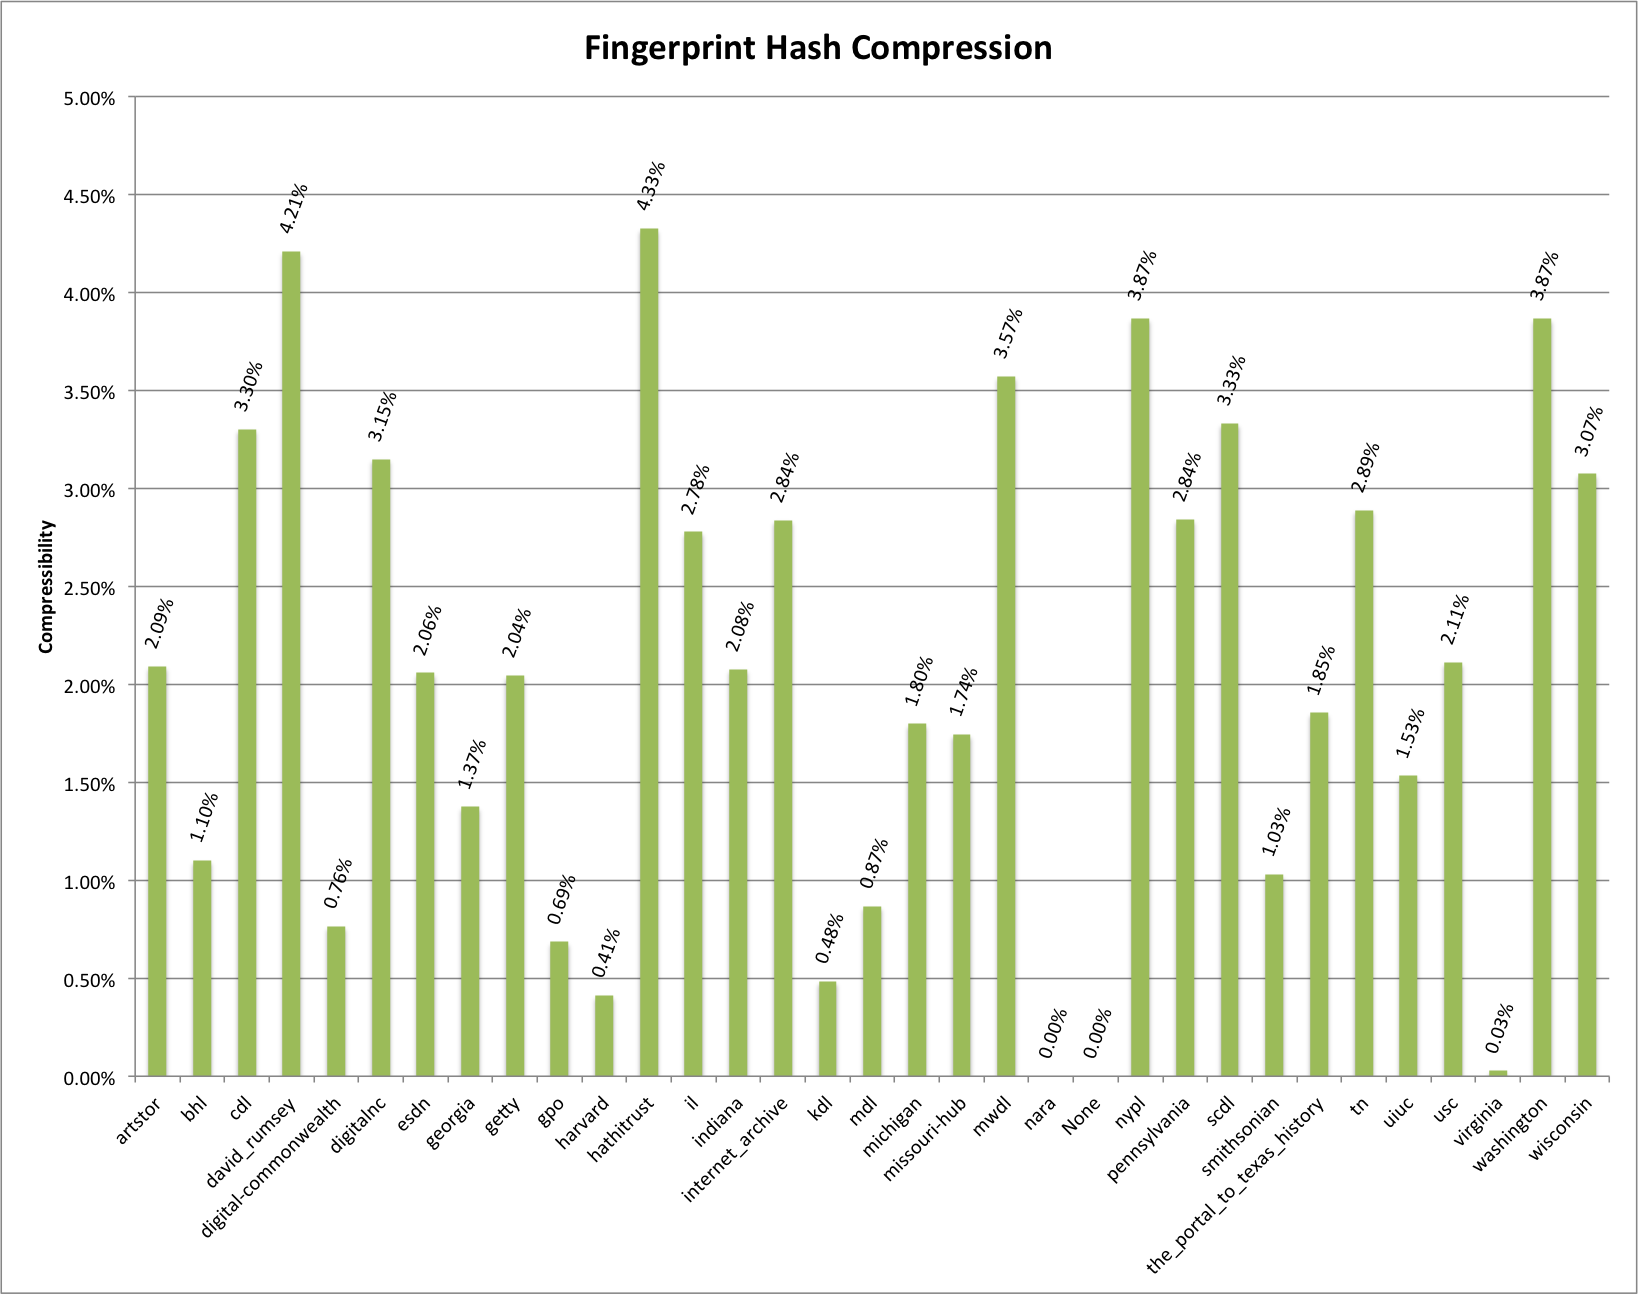
Fingerprint Hash Compressibility
Aggressive Fingerprint Hash: This algorithm takes the basic fingerprint algorithm described above and adds one more step. That step is to remove pieces of the name that are only numbers such as date. This hashing function will most likely have more false positives that any of the previous algorithms, but it is interesting to look at the results.
Aggressive Fingerprint Hash Compressibility
This final chart puts together the four previous charts so they can be compared a bit easier.

All Compressibility
Conclusion
So now we’ve looked at the compressibility of the the creator fields for each of the 32 hubs that make up the DPLA.
I’m not sure that I have any good takeaways so far in this analysis. I think there are a few other metrics that we should look at before we start saying if this information is or isn’t useful as a metric of metadata quality.
I do know that I was with the compressibility of the hathitrust creators. This is especially interesting when you consider that the source for most of those records are MARC based catalog records that in theory should be backed up with some sort of authority records. Other hubs, especially the service hubs tend to not have records that are based as much on authority records. Not really ground breaking but interesting to see in the data.
If you have questions or comments about this post, please let me know via Twitter.