In the last post I took a look at the length of the description fields for the Digital Public Library of America as a whole. In this post I wanted to spend a little time looking at these numbers on a per-provider/hub basis to see if there is anything interesting in the data.
I’ll jump right in with a table that shows all 29 of the providers/hubs that are represented in the snapshot of metadata that I am working with this time. In this table you can see the minimum record length, max length, the number of descriptions (remember values can be multi-valued so there are more descriptions than records for a provider/hub), sum (all of the lengths added together), the mean of the length and then finally the standard deviation.
| provider | min | max | count | sum | mean | stddev |
| artstor | 0 | 6,868 | 128,922 | 9,413,898 | 73.02 | 178.31 |
| bhl | 0 | 100 | 123,472 | 775,600 | 6.28 | 8.48 |
| cdl | 0 | 6,714 | 563,964 | 65,221,428 | 115.65 | 211.47 |
| david_rumsey | 0 | 5,269 | 166,313 | 74,401,401 | 447.36 | 861.92 |
| digital-commonwealth | 0 | 23,455 | 455,387 | 40,724,507 | 89.43 | 214.09 |
| digitalnc | 1 | 9,785 | 241,275 | 45,759,118 | 189.66 | 262.89 |
| esdn | 0 | 9,136 | 197,396 | 23,620,299 | 119.66 | 170.67 |
| georgia | 0 | 12,546 | 875,158 | 135,691,768 | 155.05 | 210.85 |
| getty | 0 | 2,699 | 264,268 | 80,243,547 | 303.64 | 273.36 |
| gpo | 0 | 1,969 | 690,353 | 33,007,265 | 47.81 | 58.20 |
| harvard | 0 | 2,277 | 23,646 | 2,424,583 | 102.54 | 194.02 |
| hathitrust | 0 | 7,276 | 4,080,049 | 174,039,559 | 42.66 | 88.03 |
| indiana | 0 | 4,477 | 73,385 | 6,893,350 | 93.93 | 189.30 |
| internet_archive | 0 | 7,685 | 523,530 | 41,713,913 | 79.68 | 174.94 |
| kdl | 0 | 974 | 144,202 | 390,829 | 2.71 | 24.95 |
| mdl | 0 | 40,598 | 483,086 | 105,858,580 | 219.13 | 345.47 |
| missouri-hub | 0 | 130,592 | 169,378 | 35,593,253 | 210.14 | 2325.08 |
| mwdl | 0 | 126,427 | 1,195,928 | 174,126,243 | 145.60 | 905.51 |
| nara | 0 | 2,000 | 700,948 | 1,425,165 | 2.03 | 28.13 |
| nypl | 0 | 2,633 | 1,170,357 | 48,750,103 | 41.65 | 161.88 |
| scdl | 0 | 3,362 | 159,681 | 18,422,935 | 115.37 | 164.74 |
| smithsonian | 0 | 6,076 | 2,808,334 | 139,062,761 | 49.52 | 137.37 |
| the_portal_to_texas_history | 0 | 5,066 | 1,271,503 | 132,235,329 | 104.00 | 95.95 |
| tn | 0 | 46,312 | 151,334 | 30,513,013 | 201.63 | 248.79 |
| uiuc | 0 | 4,942 | 63,412 | 3,782,743 | 59.65 | 172.44 |
| undefined_provider | 0 | 469 | 11,436 | 2,373 | 0.21 | 6.09 |
| usc | 0 | 29,861 | 1,076,031 | 60,538,490 | 56.26 | 193.20 |
| virginia | 0 | 268 | 30,174 | 301,042 | 9.98 | 17.91 |
| washington | 0 | 1,000 | 42,024 | 5,258,527 | 125.13 | 177.40 |
This table is very helpful to reference as we move through the post but it is rather dense. I’m going to present a few graphs that I think illustrate some of the more interesting things in the table.
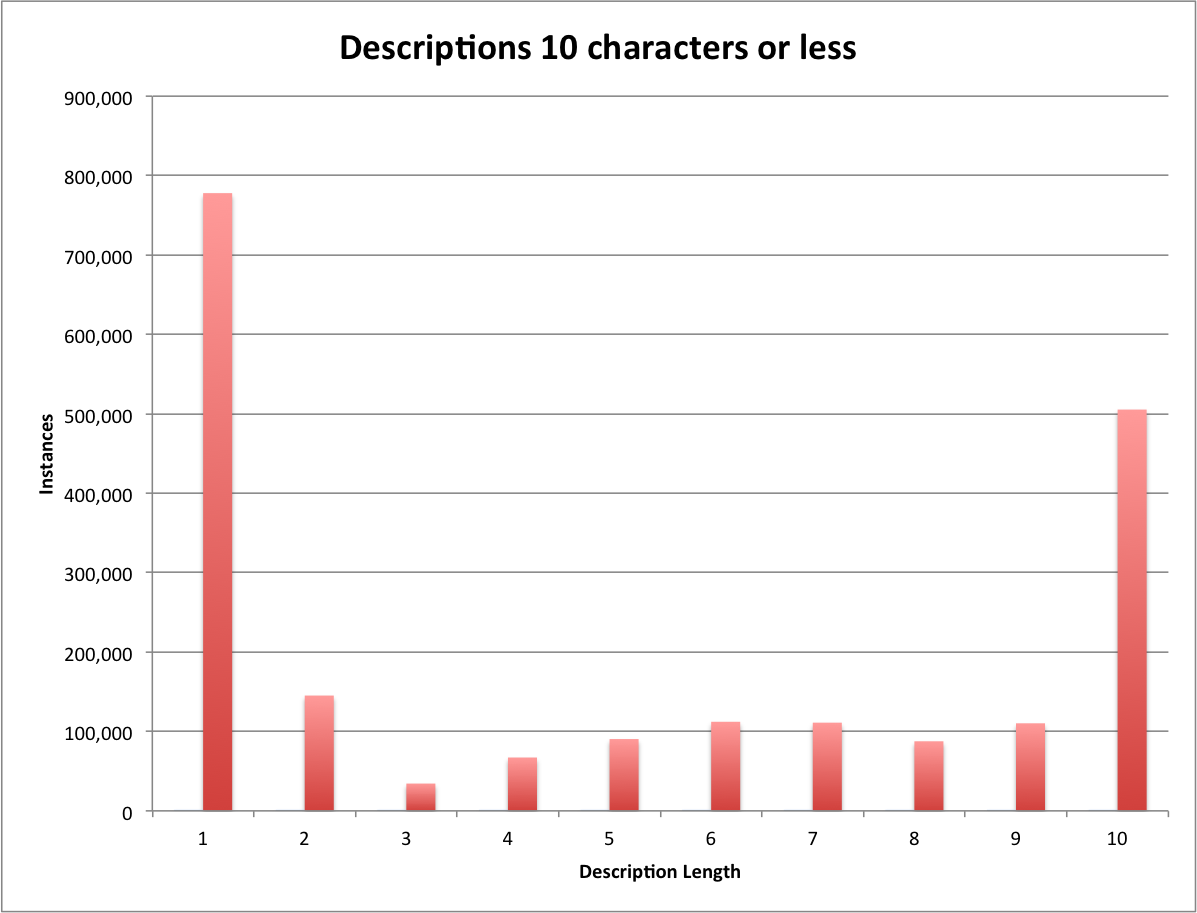
Average Description Length
The first is to just look at the average description length per provider/hub to see if there is anything interesting in there.
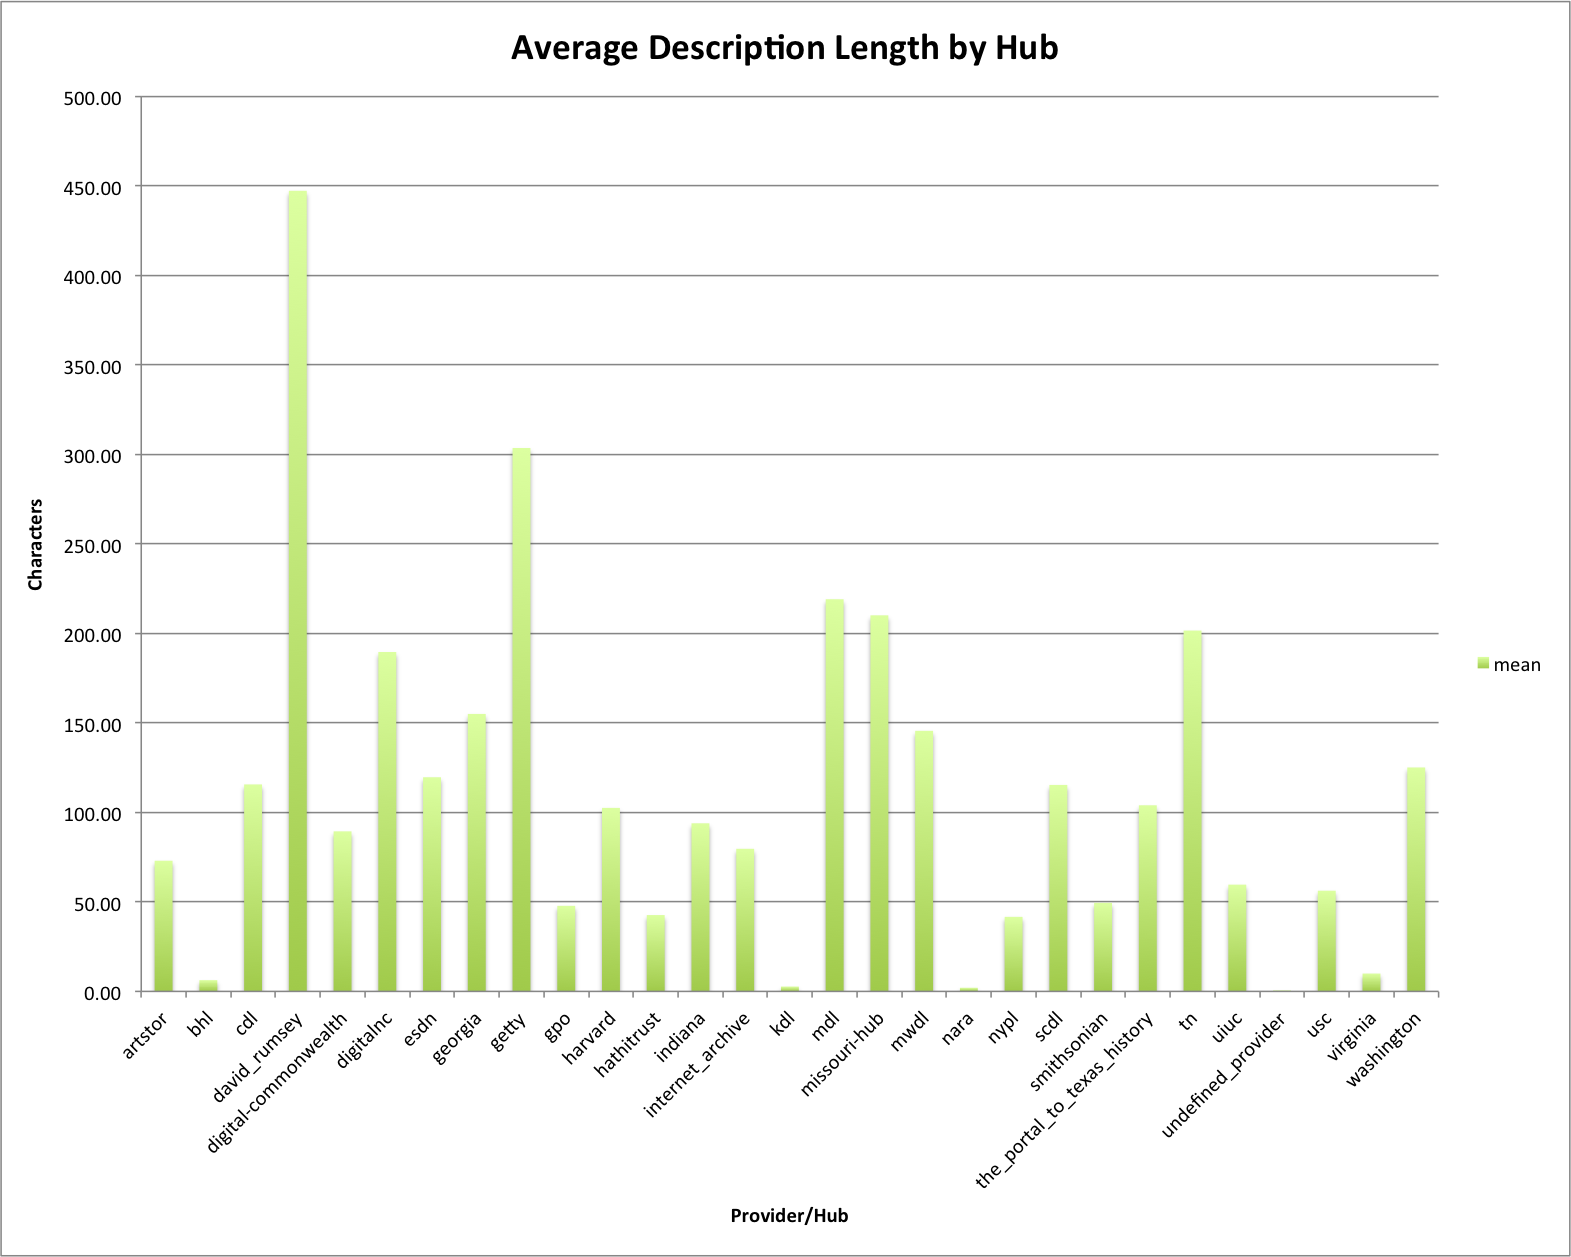
Average Description Length by Hub
For me I see that there are several bars that are very small on this graph, specifically for the providers bhl, kdl, nara, unidentified_provider, and virginia. I also noticed that david_rumsey has the highest average description length of 450 characters. Following david_rumsey is getty at 300 and then mmdl, missouri, and tn who are at about 200 characters for the average length.
One thing to keep in mind from the previous post is that the average length for the whole DPLA was 83.32 characters in length, so many of the hubs were over that and some significantly over that number.
Mean and Standard Deviation by Partner/Hub
I think it is also helpful to take a look at the standard deviation in addition to just the average, that way you are able to get a sense of how much variability there is in the data.
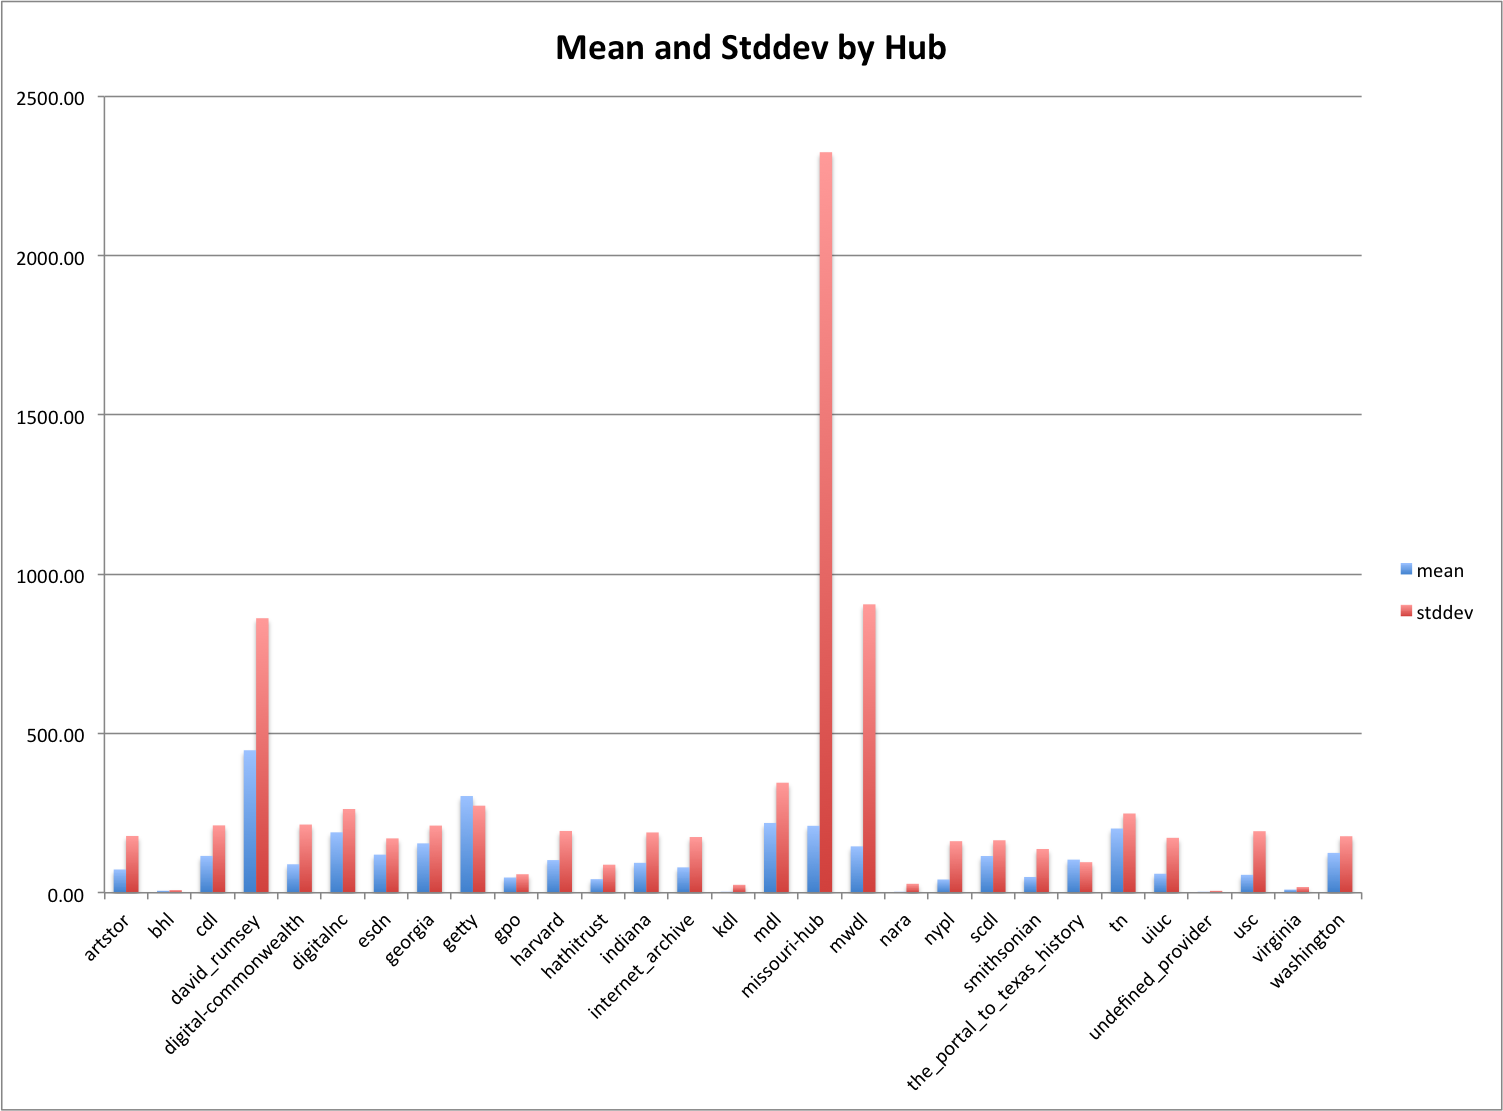
Description Length Mean and Stddev by Hub
There are a few providers/hubs that I think stand out from the others by looking at the chart. First david_rumsey has a stddev just short of double its average length. The mwdl and the missouri-hub have a very high stddev compared to their average. For this dataset, it appears that these partners have a huge range in their lengths of descriptions compared to others.
There are a few that have a relatively small stddev compared to the average length. There are just two partners that actually have a stddev lower than the average, those being the_portal_to_texas_history and getty.
Longest Description by Partner/Hub
In the last blog post we saw that there was a description that was over 130,000 characters in length. It turns out that there were two partner/hubs that had some seriously long descriptions.
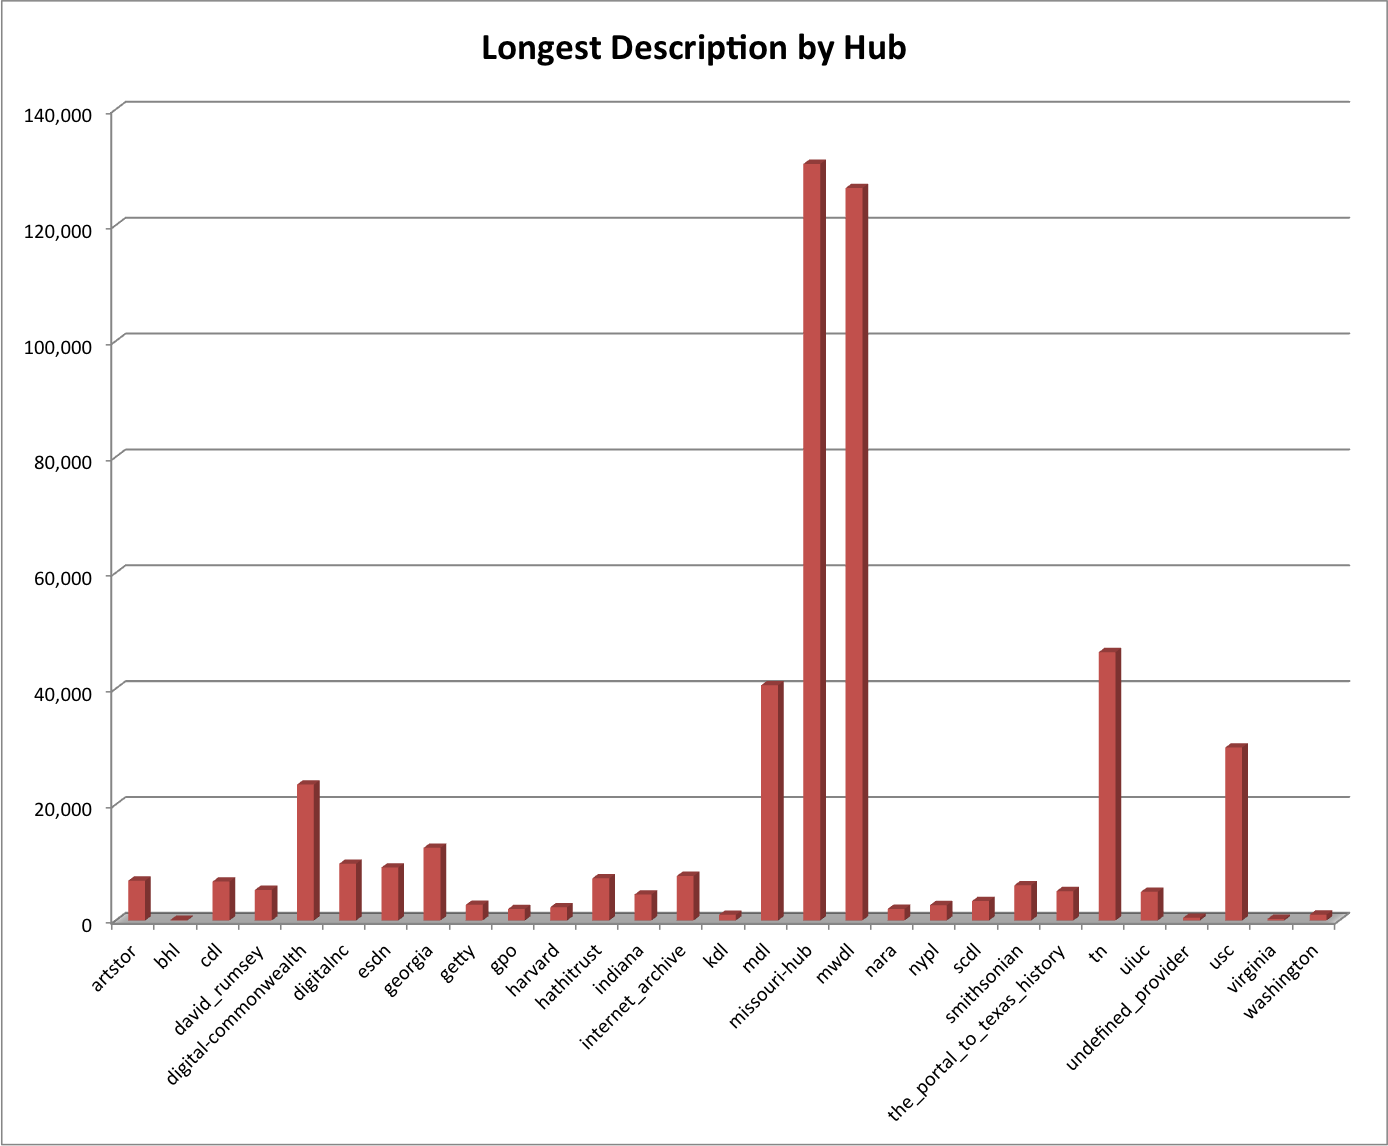
Longest Description by Hub
Remember the chart before this one that showed the average and the stddev next to each other for the Provider/Hub, there we said a pretty large stddev for missouri_hub and mwdl? You may see why that is with the chart above. Both of these hubs have descriptions of over 120,000 characters.
There are six Providers/Hubs that have some seriously long descriptions, digital-commonwealth, mdl, missouri_hub, mwdl, tn, and usc. I could be wrong but I have a feeling that descriptions that long probably aren’t that helpful for users and are most likely the full-text of the resource making its way into the metadata record. We should remember, “metadata is data about data”… not the actual data.
Total Description Length of Descriptions by Provider/Hub
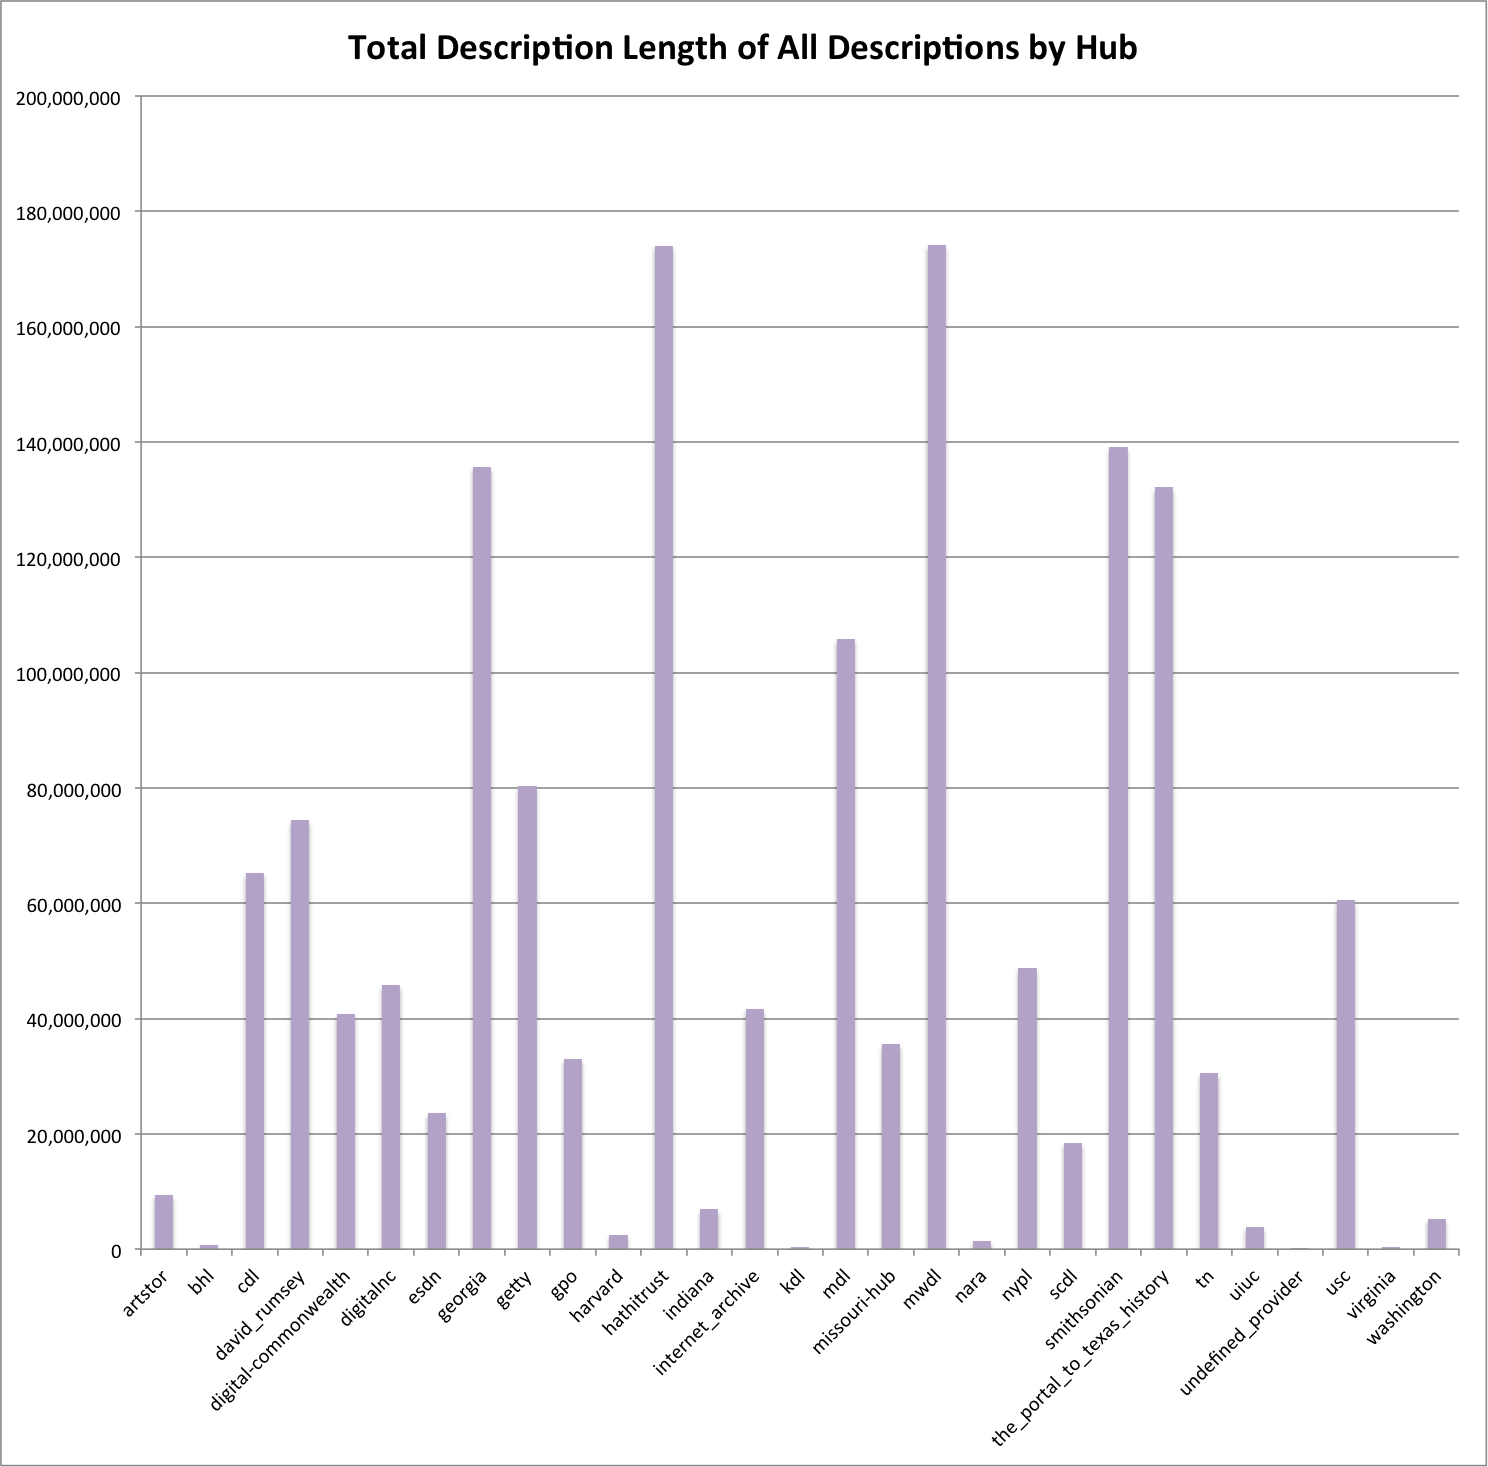
Total Description Length of All Descriptions by Hub
Just for fun I was curious about how the total lengths of the description fields per provider/hub would look on a graph, those really large numbers are hard to hold in your head.
It is interesting to note that hathitrust which has the most records in the DPLA doesn’t contribute the most description content. In fact the most is contributed by mwdl. If you look into the sourcing of these records you will have an understanding of why with the majority of the records in the hathitrust set coming from MARC records which typically don’t have the same notion of “description” that records from digital libraries and formats like Dublin Core have. The provider/hub mwdl is an aggregator of digital library content and has quite a bit more description content per record.
Other providers/hubs of note are georgia, mdl, smithsonian, and the_portal_to_texas_history which all have over 100,000,000 characters in their descriptions.
Closing for this post
Are there other aspects of this data that you would like me to take a look at? One idea I had was to try and determine on a provider/hub basis what might be a notion of “too long” for a given provider based on some methods of outlier detection, I’ve done the work for this but don’t know enough about the mathy parts to know if it is relevant to this dataset or not.
I have about a dozen more metrics that I want to look at for these records so I’m going to have to figure out a way to move through them a bit quicker otherwise this blog might get a little tedious (more than it already is?).
If you have questions or comments about this post, please let me know via Twitter.